When Los Angeles Becomes a Bay
Los Angeles developed in a basin wedged between the Pacific and the San Gabriel Mountains. The topography is relatively flat and sits low. Downtown LA: 87 meters (285 feet) above sea level. Long Beach: 9 meters (30 feet). Santa Monica: 32 meters (105 feet). Compton: 24 meters (79 feet). Jeffrey Linn used relief maps to show what an 80-meter sea level rise would do. Most of the city would be gone.

Back in 2015, Jeffrey Linn took USGS data about what happens when all the ice on Earth melts—80.3 meters (over 260 feet) of sea level rise—and turned it into a map. Los Angeles Bay replaced the basin, with new names marking where neighborhoods used to be.
“Strait Outta Compton” runs through Compton’s former location. The airport became “Ex-LAX.” Downey? “Drowney.” Beverly Hills’ 90210 zip code? “9021 Cove.” Knott’s Berry Farm? “Knott’s Oyster Farm.” “The O. Sea” covers the central basin. Further north there’s “Firth of Fullerton,” plus “Huntington Abyss” and “Mudflats of El Monte.”
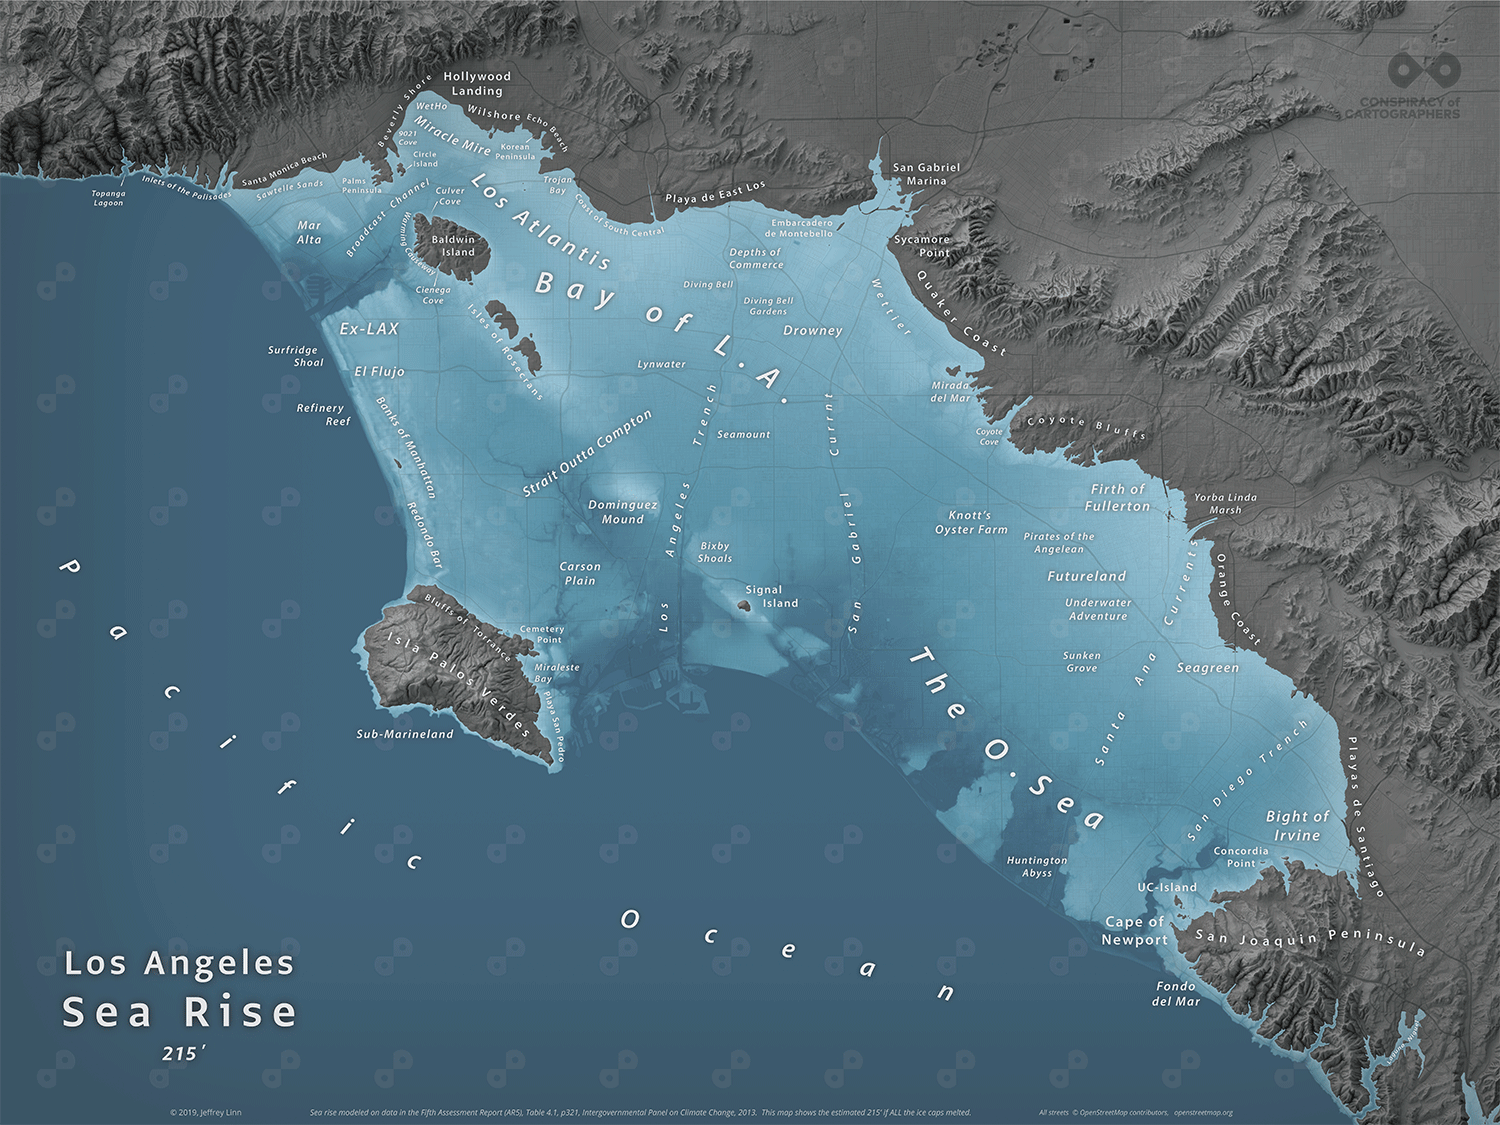
Linn made a second version using different projections showing 215 feet (65.5 meters) of rise. The numbers changed slightly, but the basin still ends up underwater.
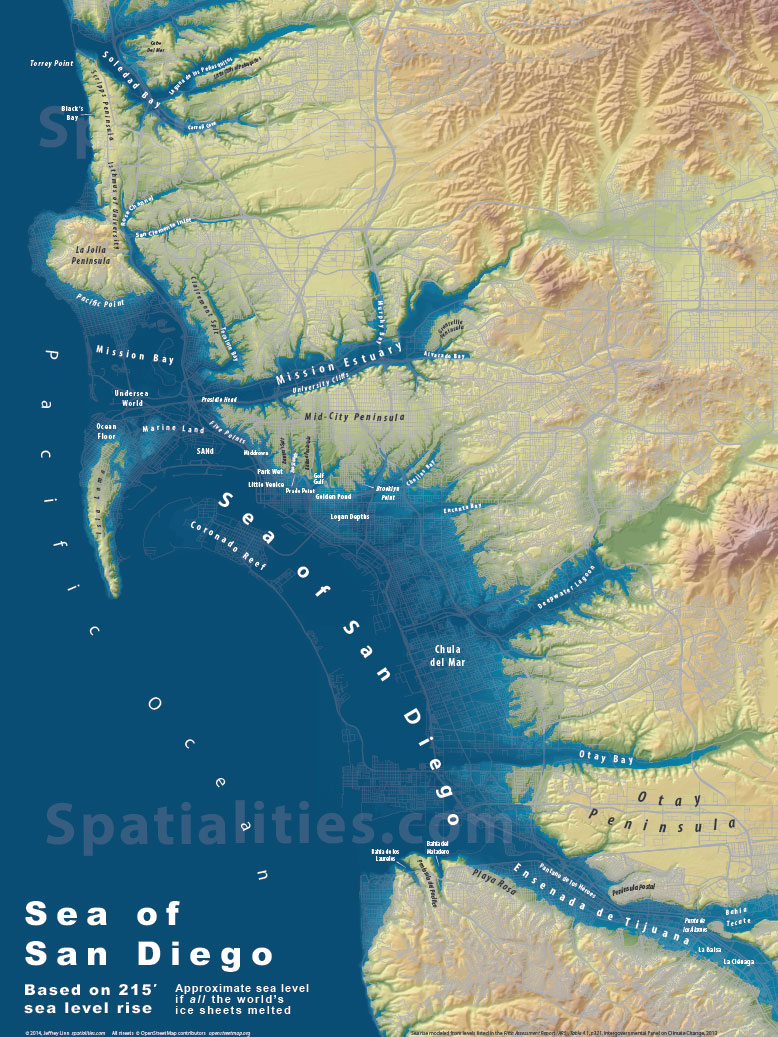
His third map tackles San Diego the same way. The bay expands inland, coastal neighborhoods disappear, and what’s left reorganizes around the remaining hills.
Linn’s been making these since 2013. His work has shown up in the Washington Post and Foreign Policy. He calls his project “Conspiracy of Cartographers”—a dig at people who think climate change is fake. If there’s a conspiracy, it’s physics. You can grab prints at conspiracyofcartographers.com.
Here you can find another map created by Jeffrey Linn, which shows the Islands of Seattle.


