The numbers are staggering – approximately 40 million casualties in World War I, including up to 20 million deaths and 21 million wounded. But these figures, while overwhelming, can feel abstract. Through these carefully selected maps, we can better understand the profound impact this conflict had on nations and their people.
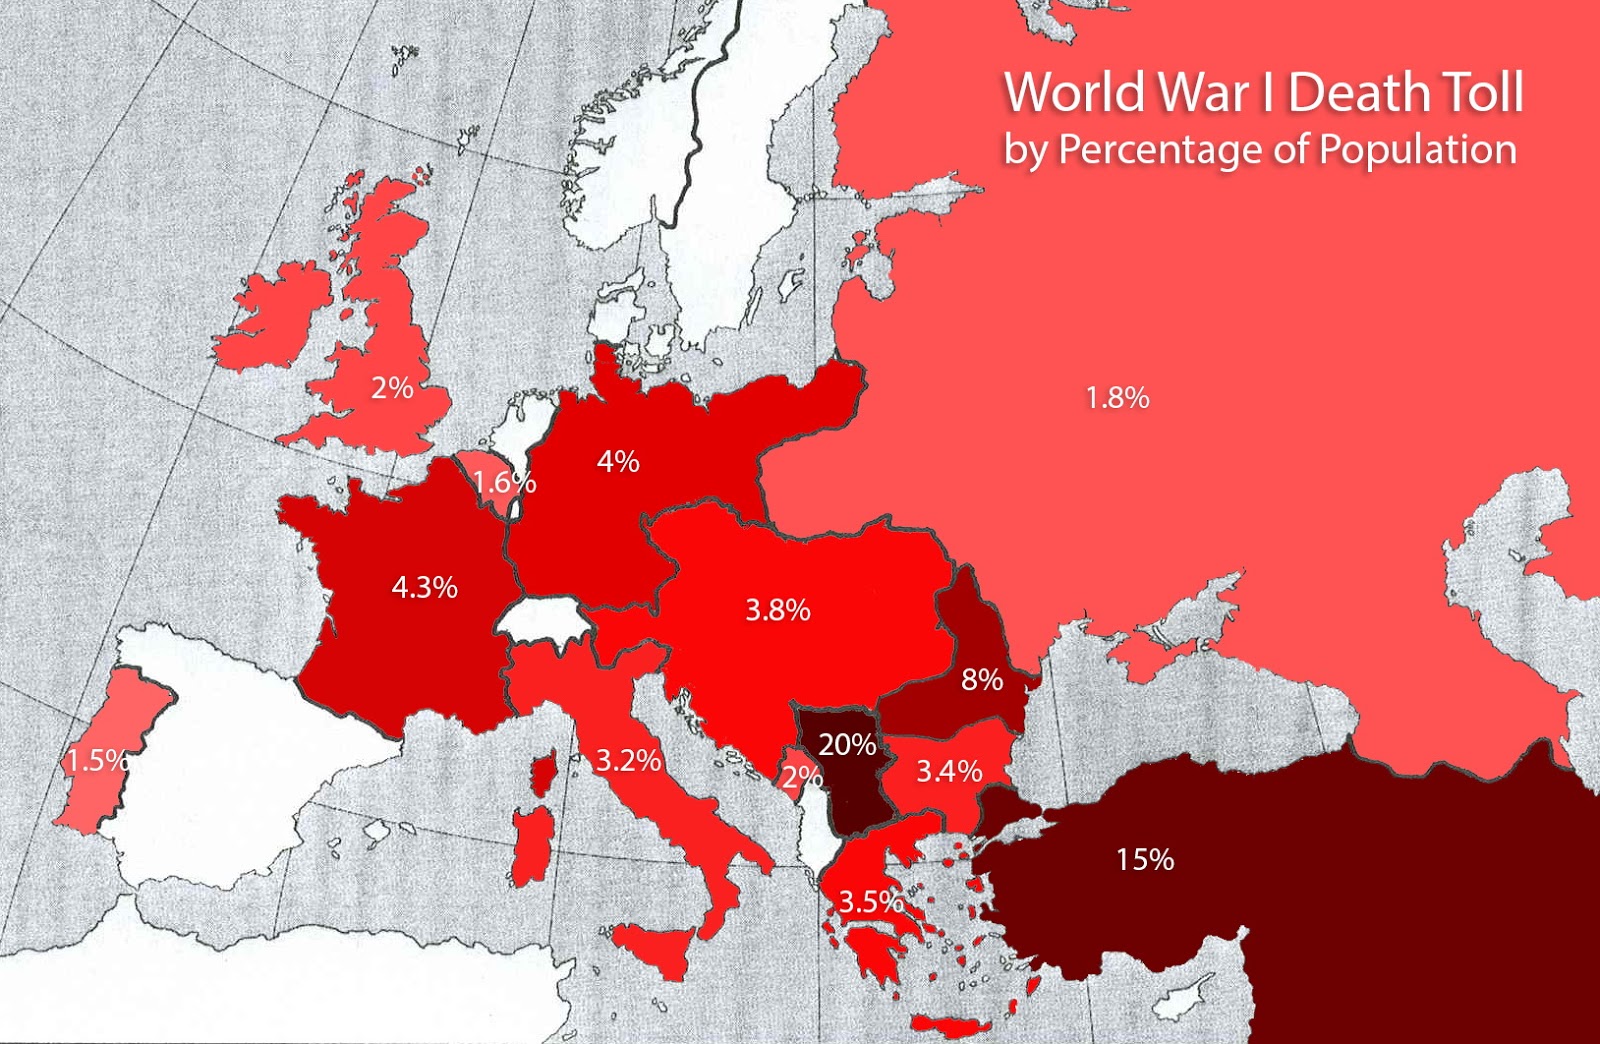
Let’s start with the raw numbers. The Russian Empire suffered the highest absolute losses, with up to 3.4 million deaths. However, when we look at the percentage of population lost, a different picture emerges. Serbia endured the war’s heaviest relative toll, losing between 16.67% and 27.78% of its population – the highest proportional loss of any nation in the conflict.
Reddit user: Krizerion
The mobilization efforts were unprecedented. In France, nearly 80% of men aged 15-49 were conscripted into military service. According to military historian David Stevenson, this level of mobilization had never been seen before in human history and wouldn’t be matched until World War II.
Source: www.historynutshell.com
Some of the most striking statistics come from the smaller nations. Belgium, despite its relatively small size, lost up to 144,337 people. New Zealand, half a world away from the conflict, saw nearly 18,000 of its citizens perish – a staggering 1.64% of its population.
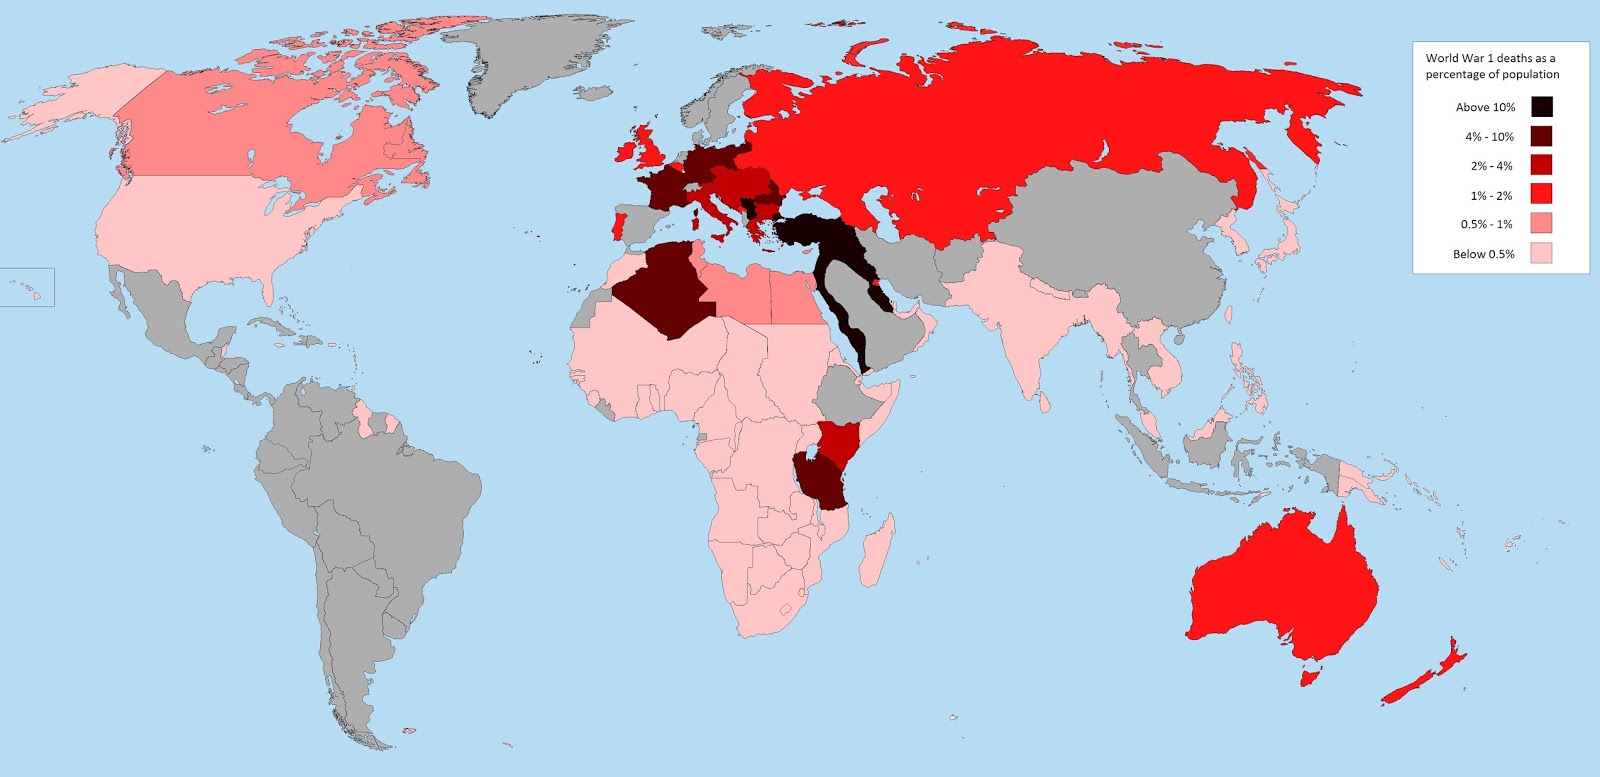
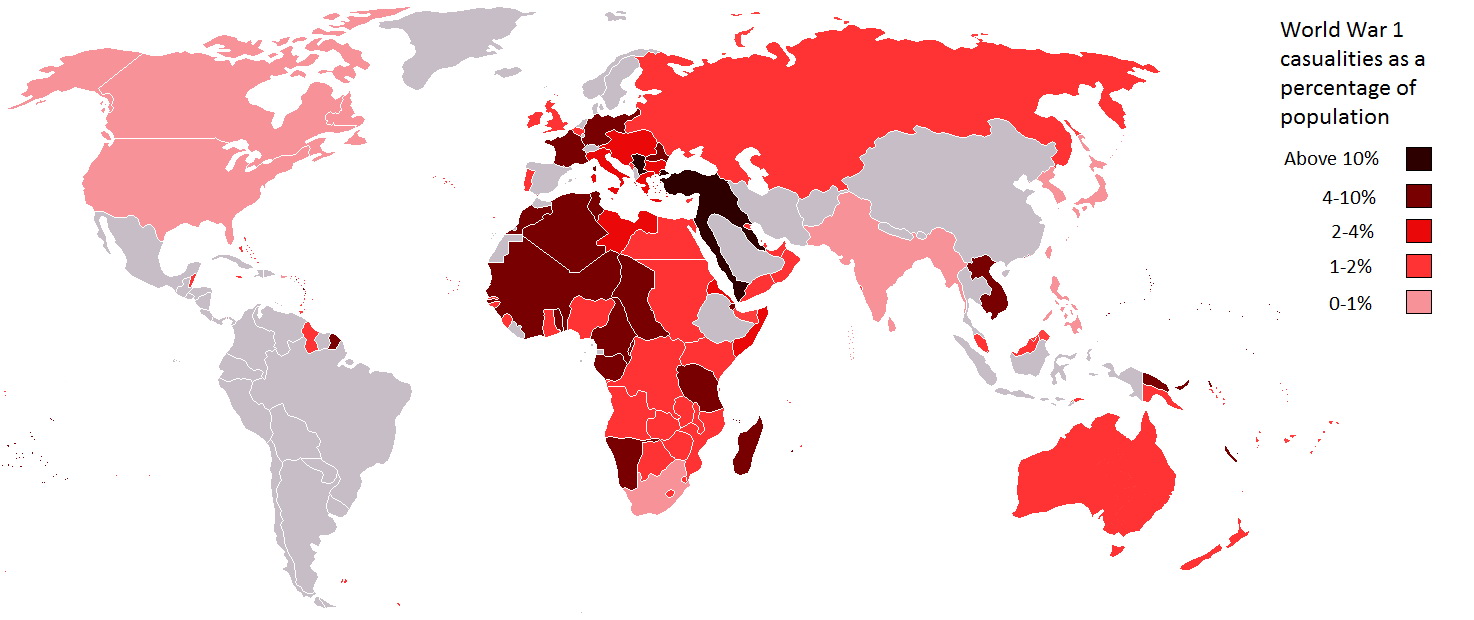
The world maps below show countries by the number of deaths and casualties as a percentage of the population in World War I.
World countries by the number of deaths in WW1World War 1 casualties as a percentage of the population
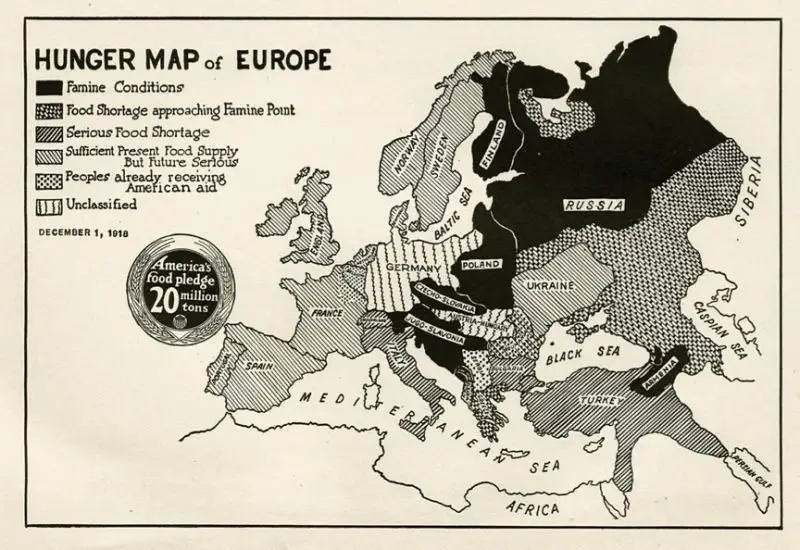
The war’s aftermath brought new challenges. As armies moved across Europe, they disrupted farming and food distribution networks. This, combined with naval blockades and poor harvests, led to severe food shortages across the continent.
Reddit user: From_The_Sun
According to the International Committee of the Red Cross archives, by 1918, the average citizen in Vienna was surviving on just 1,000 calories per day – less than half the recommended intake. In Germany, the food situation was so dire that the period became known as the “Turnip Winter,” as turnips often replaced potatoes and bread as dietary staples.
This post tells a story not just through numbers, but through carefully mapped data that shows the true human cost of what was supposed to be “the war to end all wars.” These visualizations help us better understand both the immediate impact of the conflict and its lasting effects on European society.


Canadian textbooks are silent on the death toll of Eastern Europeans … Serbia … and Turkey!
Portugal was involved in the First World War? I had no idea.
Interesting that Turkey/Ottomans had the most casualties. I don’t remember being taught that.
its changed over time. the flags have changed, that’s all i’ve got