Death toll across European nations during WWII. The darker shades represent higher casualties. Source: historynutshell.com
The scale of World War II’s human cost defies comprehension – over 60 million lives lost, representing 3% of the world’s 1940 population of 2.3 billion. Behind these numbers lie countless personal tragedies that transformed families, communities, and entire nations.
The Soviet Union bore the heaviest burden, with military historian Richard Overy noting that Soviet deaths might have reached 27 million (Amazon link: “Russia’s War: A History of the Soviet Effort: 1941-1945“). This included not only military casualties but also civilians who perished from bombing, starvation, disease, and systematic genocide.
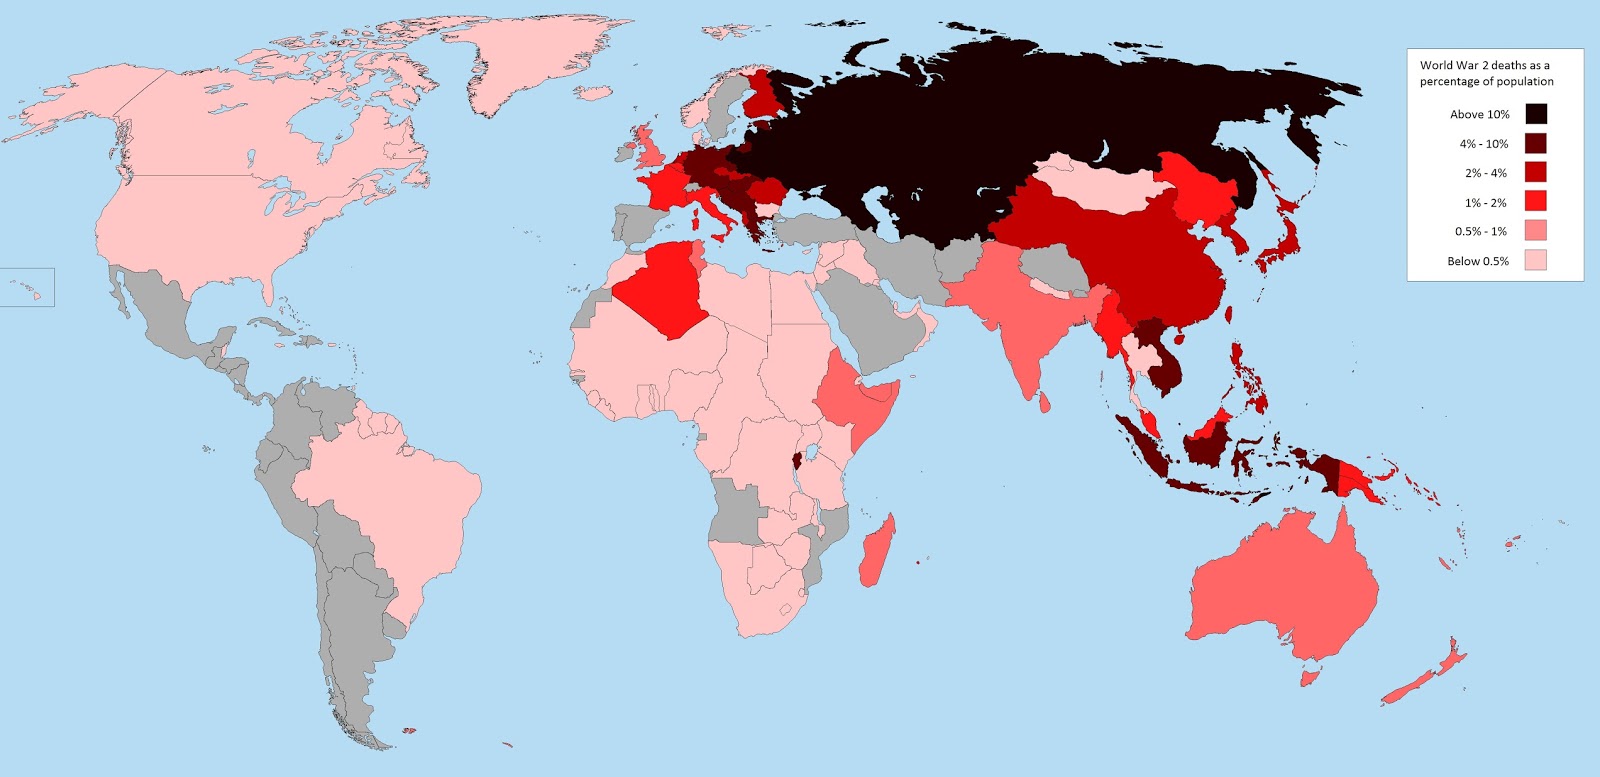
The devastating impact of WWII shown as a percentage of each country’s pre-war population reveals a different perspective on the conflict’s toll
Poland lost nearly 17% of its pre-war population – almost one in five citizens. This staggering figure includes three million Polish Jews who perished in the Holocaust. According to the United States Holocaust Memorial Museum, the Nazi genocide claimed approximately six million Jewish lives total, forever altering the demographic and cultural landscape of Europe.
The global distribution of WWII casualties shows how the conflict’s impact reached far beyond Europe.
The war’s reach extended far beyond Europe. China endured what historian Rana Mitter calls “the forgotten ally’s war” (Amazon link: “China’s War with Japan, 1937-1945: The Struggle for Survival“). Chinese casualties are estimated between 15-20 million, with some researchers suggesting even higher numbers.
Breaking down the casualties by theater of war reveals the conflict’s global nature:
European Theater: 40 million deaths
Pacific Theater: 30 million deaths
Atlantic Ocean Theater: 80,000 deaths
African Theater: 117,000 deaths
Middle Eastern Theater: 5,000 deaths
Indian Ocean Theater: 20,000 deaths
American Theater: Less than 100 deaths
The contrast between these numbers tells its own story. While the American mainland remained largely untouched (fewer than 100 civilian deaths), cities across Europe and Asia endured devastating bombing campaigns. The British War Office estimates that strategic bombing alone claimed 600,000 German civilian lives.
Civilian Casualties: A Dark New Chapter in Warfare Unlike previous conflicts, WWII saw civilian casualties exceed military deaths. The development of strategic bombing and the systematic persecution of civilian populations marked a tragic turning point in military history. According to military historian Max Hastings (Amazon link: “Inferno: The World at War, 1939-1945“), civilian deaths accounted for nearly 60% of total casualties.
Here’s a comprehensive table of WWII casualties by country:
Country
Military Deaths
Civilian Deaths
Total Deaths
% of Pre-war Population
Soviet Union
8,800,000 – 10,700,000
16,000,000 – 17,000,000
24,000,000 – 27,000,000
13.7%
China
4,000,000
16,000,000
20,000,000
3.86%
Germany
5,318,000
3,810,000
9,128,000
11.5%
Poland
240,000
5,620,000
5,860,000
17.2%
Japan
2,120,000
1,000,000
3,120,000
4.1%
Yugoslavia
446,000
1,014,000
1,460,000
9.3%
Romania
450,000
465,000
915,000
5.6%
France
217,600
350,000
567,600
1.35%
Hungary
300,000
280,000
580,000
6.2%
Greece
35,100
325,000
360,100
5.2%
Great Britain
383,600
67,200
450,800
0.94%
United States
416,800
6,000
422,800
0.32%
Italy
301,400
153,200
454,600
1.02%
Netherlands
17,000
284,000
301,000
3.4%
Belgium
12,100
76,000
88,100
1.05%
Finland
95,000
2,000
97,000
2.57%
Canada
45,400
–
45,400
0.38%
Australia
40,500
–
40,500
0.57%
New Zealand
12,100
–
12,100
0.73%
The Long Shadow The war’s demographic impact extended well beyond 1945. According to population studies, the “lost generation” of young men created gender imbalances that persisted for decades in many European countries, particularly in the Soviet Union, where some regions recorded ratios of four women to every man in the immediate post-war years.