New York City logged 530,194 complaints to the NYPD in 2006. Fourteen years of mostly falling numbers brought that down to 414,250 by 2020. Then it reversed.
Citywide NYPD complaints climbed from that 2020 low to 573,303 in 2024, a new high point in this dataset, before easing slightly to 566,370 in 2025, a figure that still stands above where the city started in 2006, based on NYPD Complaint Data Historic. Four of the five boroughs now report more complaints than they did 20 years ago. Only Staten Island remains below its 2006 level.
Key takeaways
Citywide complaints rose 6.8 percent from 2006 to 2025, after falling as much as 22 percent below the 2006 mark along the way.
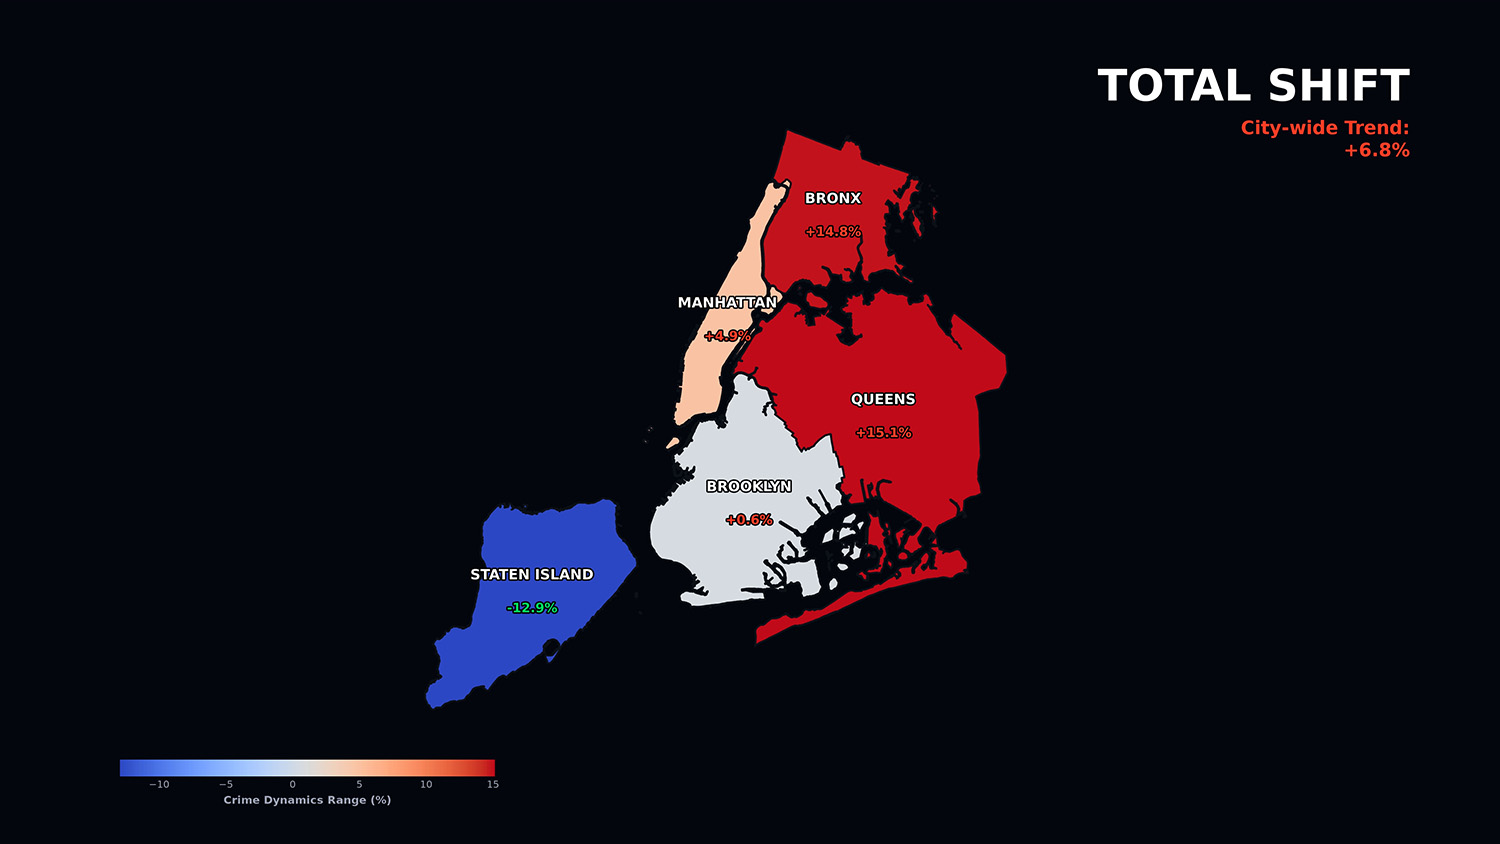
Queens and the Bronx posted the largest 20 year gains, up 15.2 percent and 14.8 percent, while Staten Island is the only borough still below its 2006 total, down 12.9 percent.
Petit larceny was the single most common complaint in Brooklyn, Manhattan, and Queens every year from 2006 through 2025, with no exceptions.
The Bronx has cycled through harassment, drug offenses, and petit larceny as its top complaint, and has stayed on harassment for its longest stretch yet, eight straight years from 2018 to 2025.
Manhattan logged more daytime complaints than evening ones in all 20 years measured. The Bronx never settled into either pattern, flipping seven times over the same period.
How much did complaints actually change from 2006 to 2025?
Complaints declined most years from 2006 through 2020, reaching 414,250, down 22 percent from the 2006 starting point. From there, the citywide count rose in every year but one, up 38 percent by 2024, before dipping 1 percent in 2025. Net across the full 20 years, citywide complaints are up 6.8 percent.
Queens rose 15.2 percent and the Bronx rose 14.8 percent, the two largest 20 year gains. Manhattan rose 4.9 percent and Brooklyn essentially landed back where it started, up 0.6 percent, despite a deep dip in between. Staten Island is the outlier in the other direction, down 12.9 percent from 2006, and the only borough whose highest total in the entire dataset was its very first year.
Borough
2006 complaints
2025 complaints
20 year change
Queens
105,669
121,677
+15.2 percent
Bronx
111,443
127,962
+14.8 percent
Manhattan
127,762
133,968
+4.9 percent
Brooklyn
158,191
159,142
+0.6 percent
Staten Island
27,129
23,621
-12.9 percent
NYC citywide
530,194
566,370
+6.8 percent
What stayed the same, and what didn’t?
Petit larceny kept the top spot in Brooklyn, Manhattan, and Queens for all 20 years without a single break. Staten Island’s top complaint was harassment every year except 2008, when vandalism briefly took over. The Bronx was the one borough that kept changing, harassment in 2006, drug offenses from 2007 to 2011, petit larceny from 2012 to 2017, then harassment again from 2018 through 2025.
Manhattan logged more complaints during the day than the evening in every single year measured, consistent with a borough built around commuters and daytime foot traffic. Staten Island, Queens, and Brooklyn each settled into day dominant sometime between 2010 and 2015, with only a single stray evening dominant year apiece along the way. The Bronx never settled at all, splitting exactly ten years day and ten years evening, switching direction seven separate times.
Among complaints where NYPD recorded a known suspect race, Black was the most frequently recorded category in the Bronx, Brooklyn, Manhattan, and Queens for the entire 2006 to 2025 span. Staten Island is the exception, recording White most often from 2006 through 2016 before switching to Black from 2017 onward. NYPD suspect race reflects how a complainant or officer described a suspect, not a confirmed identity, and a large share of complaints across the dataset carry no suspect race at all. The figures above exclude those unknown cases rather than folding them in, so they describe the reported cases only, not the full complaint volume, and they say nothing about population size or arrest outcomes in each borough.