Provo, Utah, is the most Republican large metro area in America. It also moved toward Democrats by more than any other. Josh Metcalf of VoteHub mapped the 100 largest metros twice, once by 2024 margin and once by change since 2016, and the two rankings pull in different directions more often than not.
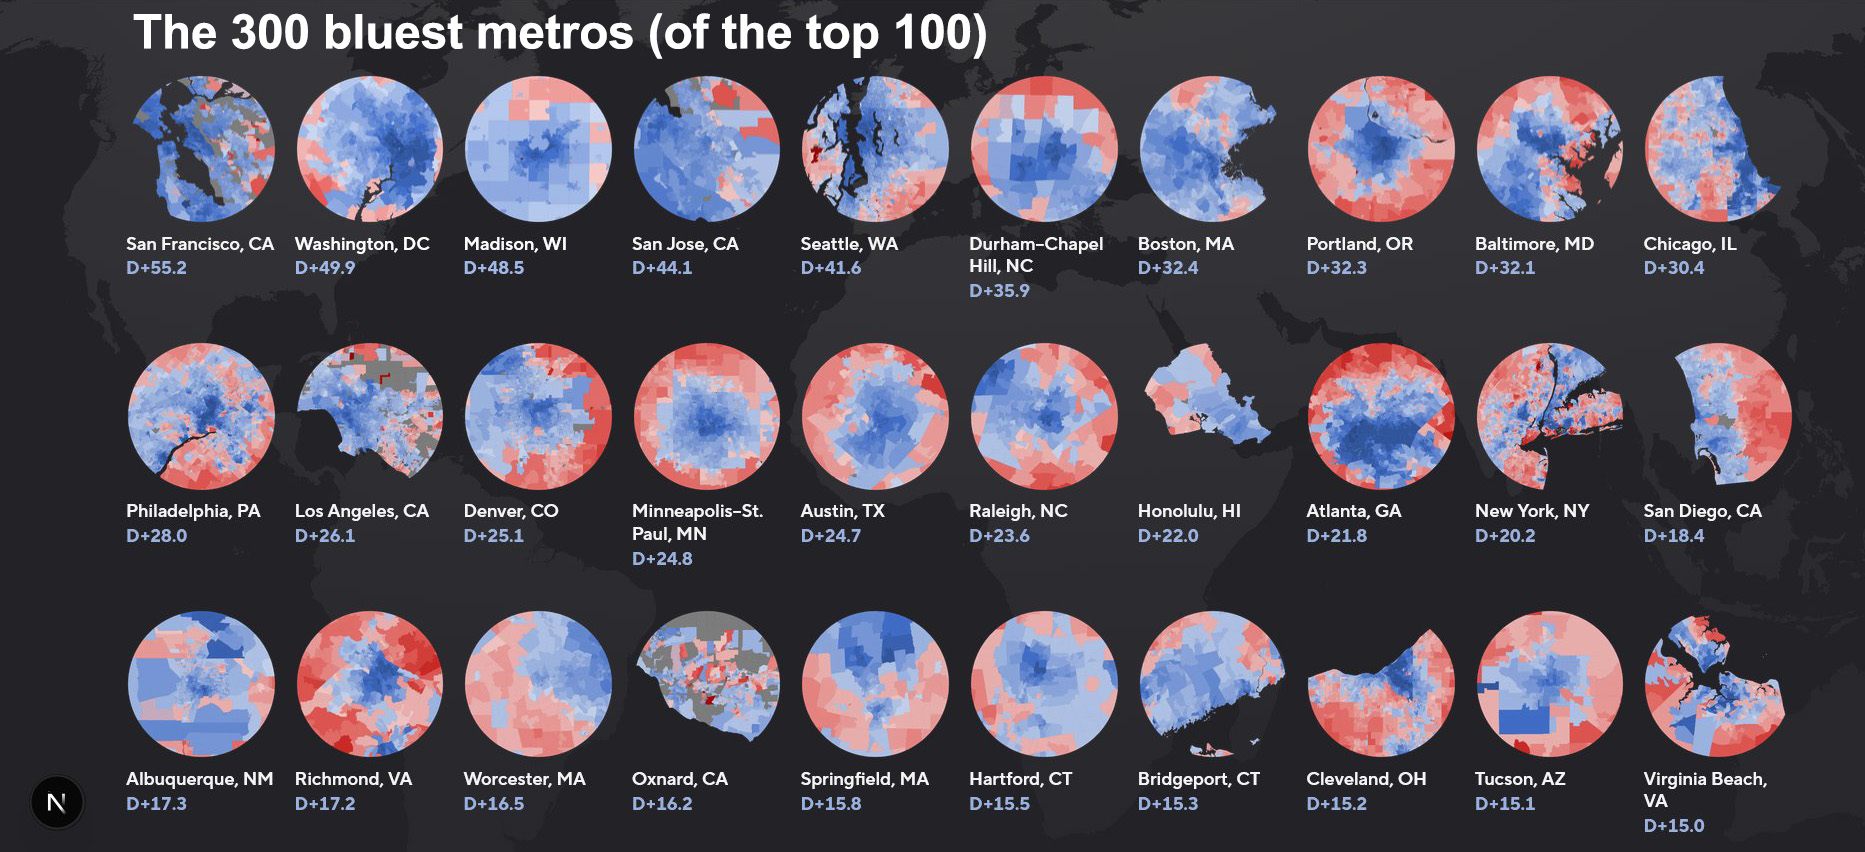
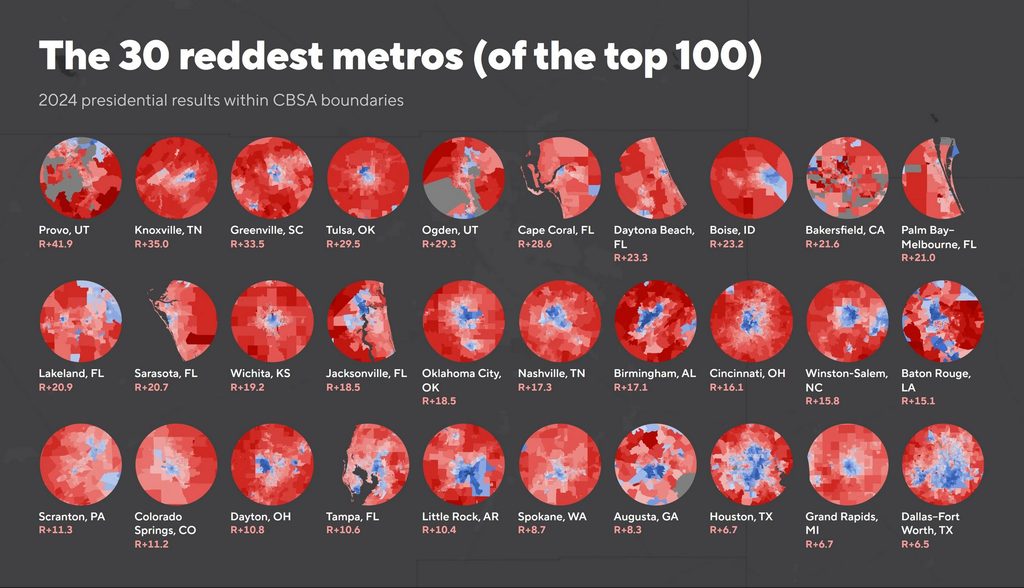
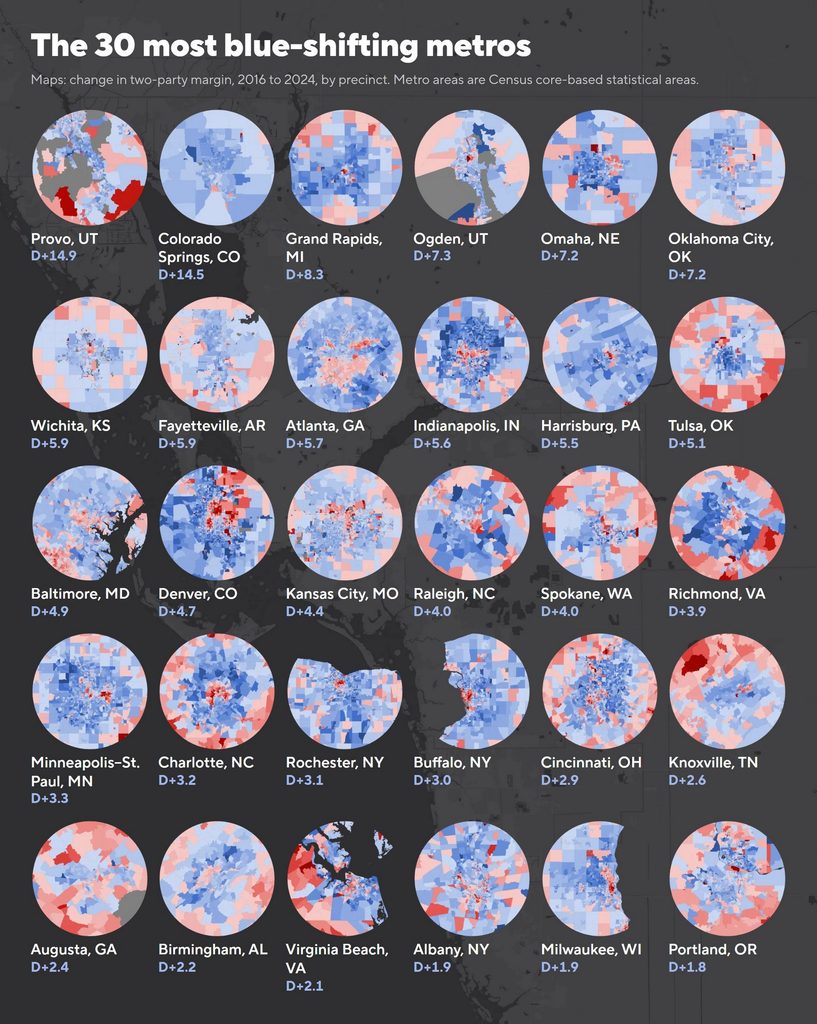
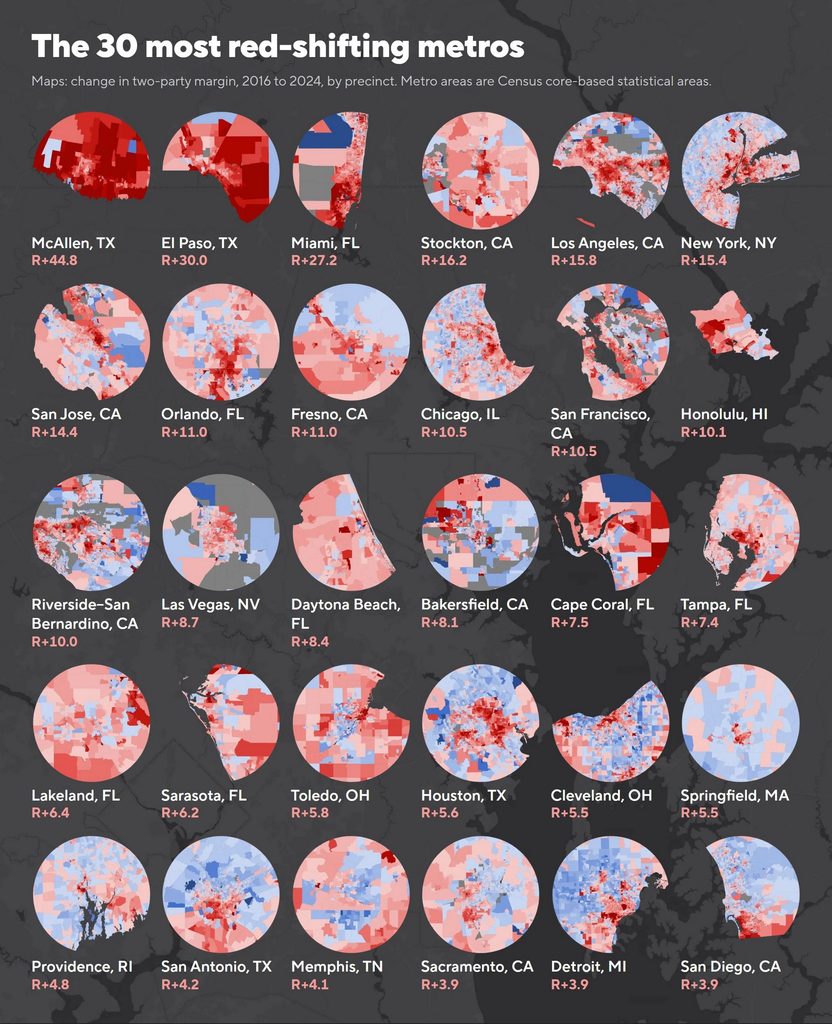
San Francisco is the most Democratic large US metro (D+55.2 in 2024) and Provo the most Republican (R+41.9). Since 2016, Provo moved toward Democrats the most (D+14.9) and McAllen, Texas toward Republicans the most (R+44.8).
Key takeaways
Of the 30 most Democratic metros, 18 moved toward Republicans between 2016 and 2024. Of the 30 most Republican, 17 moved toward Democrats.
Across all 100 metros, 46 moved toward Democrats, 51 toward Republicans and 3 stayed even.
Seven of the 30 most Republican metros are in Florida. Nine of the 30 biggest rightward movers are in California.
Which US metro areas are the most Democratic and the most Republican?
The figures use 2024 presidential results within Census core-based statistical areas, which follow whole counties and therefore include suburbs and rural edges.
Rank
Most Democratic metro
Margin
Most Republican metro
Margin
1
San Francisco, CA
D+55.2
Provo, UT
R+41.9
2
Washington, DC
D+49.9
Knoxville, TN
R+35.0
3
Madison, WI
D+48.5
Greenville, SC
R+33.5
4
San Jose, CA
D+44.1
Tulsa, OK
R+29.5
5
Seattle, WA
D+41.6
Ogden, UT
R+29.3
6
Durham-Chapel Hill, NC
D+35.9
Cape Coral, FL
R+28.6
7
Boston, MA
D+32.4
Daytona Beach, FL
R+23.3
8
Portland, OR
D+32.3
Boise, ID
R+23.2
9
Baltimore, MD
D+32.1
Bakersfield, CA
R+21.6
10
Chicago, IL
D+30.4
Palm Bay-Melbourne, FL
R+21.0
11
Philadelphia, PA
D+28.0
Lakeland, FL
R+20.9
12
Los Angeles, CA
D+26.1
Sarasota, FL
R+20.7
13
Denver, CO
D+25.1
Wichita, KS
R+19.2
14
Minneapolis-St. Paul, MN
D+24.8
Jacksonville, FL
R+18.5
15
Austin, TX
D+24.7
Oklahoma City, OK
R+18.5
16
Raleigh, NC
D+23.6
Nashville, TN
R+17.3
17
Honolulu, HI
D+22.0
Birmingham, AL
R+17.1
18
Atlanta, GA
D+21.8
Cincinnati, OH
R+16.1
19
New York, NY
D+20.2
Winston-Salem, NC
R+15.8
20
San Diego, CA
D+18.4
Baton Rouge, LA
R+15.1
21
Albuquerque, NM
D+17.3
Scranton, PA
R+11.3
22
Richmond, VA
D+17.2
Colorado Springs, CO
R+11.2
23
Worcester, MA
D+16.5
Dayton, OH
R+10.8
24
Oxnard, CA
D+16.2
Tampa, FL
R+10.6
25
Springfield, MA
D+15.8
Little Rock, AR
R+10.4
26
Hartford, CT
D+15.5
Spokane, WA
R+8.7
27
Bridgeport, CT
D+15.3
Augusta, GA
R+8.3
28
Cleveland, OH
D+15.2
Houston, TX
R+6.7
29
Tucson, AZ
D+15.1
Grand Rapids, MI
R+6.7
30
Virginia Beach, VA
D+15.0
Dallas-Fort Worth, TX
R+6.5
Washington ranks second, ahead of Madison and Seattle. Texas appears on both sides, with Austin in the Democratic top 30 and Houston and Dallas-Fort Worth in the Republican top 30.
Which metro areas shifted the most between 2016 and 2024?
The shift maps show the change in two-party margin by precinct.
Rank
Toward Democrats
Shift
Toward Republicans
Shift
1
Provo, UT
D+14.9
McAllen, TX
R+44.8
2
Colorado Springs, CO
D+14.5
El Paso, TX
R+30.0
3
Grand Rapids, MI
D+8.3
Miami, FL
R+27.2
4
Ogden, UT
D+7.3
Stockton, CA
R+16.2
5
Omaha, NE
D+7.2
Los Angeles, CA
R+15.8
6
Oklahoma City, OK
D+7.2
New York, NY
R+15.4
7
Wichita, KS
D+5.9
San Jose, CA
R+14.4
8
Atlanta, GA
D+5.7
Orlando, FL
R+11.0
9
Indianapolis, IN
D+5.6
Fresno, CA
R+11.0
10
Harrisburg, PA
D+5.5
Chicago, IL
R+10.5
11
Tulsa, OK
D+5.1
San Francisco, CA
R+10.5
12
Baltimore, MD
D+4.9
Honolulu, HI
R+10.1
13
Denver, CO
D+4.7
Riverside-San Bernardino, CA
R+10.0
14
Kansas City, MO
D+4.4
Las Vegas, NV
R+8.7
15
Raleigh, NC
D+4.0
Daytona Beach, FL
R+8.4
16
Spokane, WA
D+4.0
Bakersfield, CA
R+8.1
17
Richmond, VA
D+3.9
Cape Coral, FL
R+7.5
18
Minneapolis-St. Paul, MN
D+3.3
Tampa, FL
R+7.4
19
Charlotte, NC
D+3.2
Lakeland, FL
R+6.4
20
Rochester, NY
D+3.1
Sarasota, FL
R+6.2
21
Buffalo, NY
D+3.0
Toledo, OH
R+5.8
22
Cincinnati, OH
D+2.9
Houston, TX
R+5.6
23
Knoxville, TN
D+2.6
Cleveland, OH
R+5.5
24
Augusta, GA
D+2.4
Springfield, MA
R+5.5
25
Birmingham, AL
D+2.2
Providence, RI
R+4.8
26
Virginia Beach, VA
D+2.1
San Antonio, TX
R+4.2
27
Albany, NY
D+1.9
Memphis, TN
R+4.1
28
Milwaukee, WI
D+1.9
Sacramento, CA
R+3.9
29
Portland, OR
D+1.8
Detroit, MI
R+3.9
30
St. Louis, MO
D+1.6
San Diego, CA
R+3.9
Which metros moved against their lean?
Eighteen of the 30 most Democratic metros moved toward Republicans, led by Los Angeles (R+15.8), New York (R+15.4) and San Jose (R+14.4). Seventeen of the 30 most Republican moved toward Democrats, with Provo, Ogden, Colorado Springs and Grand Rapids on both the Republican list and the blue-shift list. Others kept going the same way. Daytona Beach (R+8.4) and Bakersfield (R+8.1) became more Republican, while Atlanta (D+5.7) and Baltimore (D+4.9) became more Democratic.