The population aged 65 and older in the United States is 54.1 million. They represented 16 percent of the population, more than 1 in every 7 U.S. citizens. The number of older Americans has grown by 14.4 million (or 36%) since 2009, compared to a rise of 3 percent for the under-65 U.S. population.
The U.S. States with the highest percentage of populations aged 65+ are Maine, Florida, West Virginia, and Vermont.
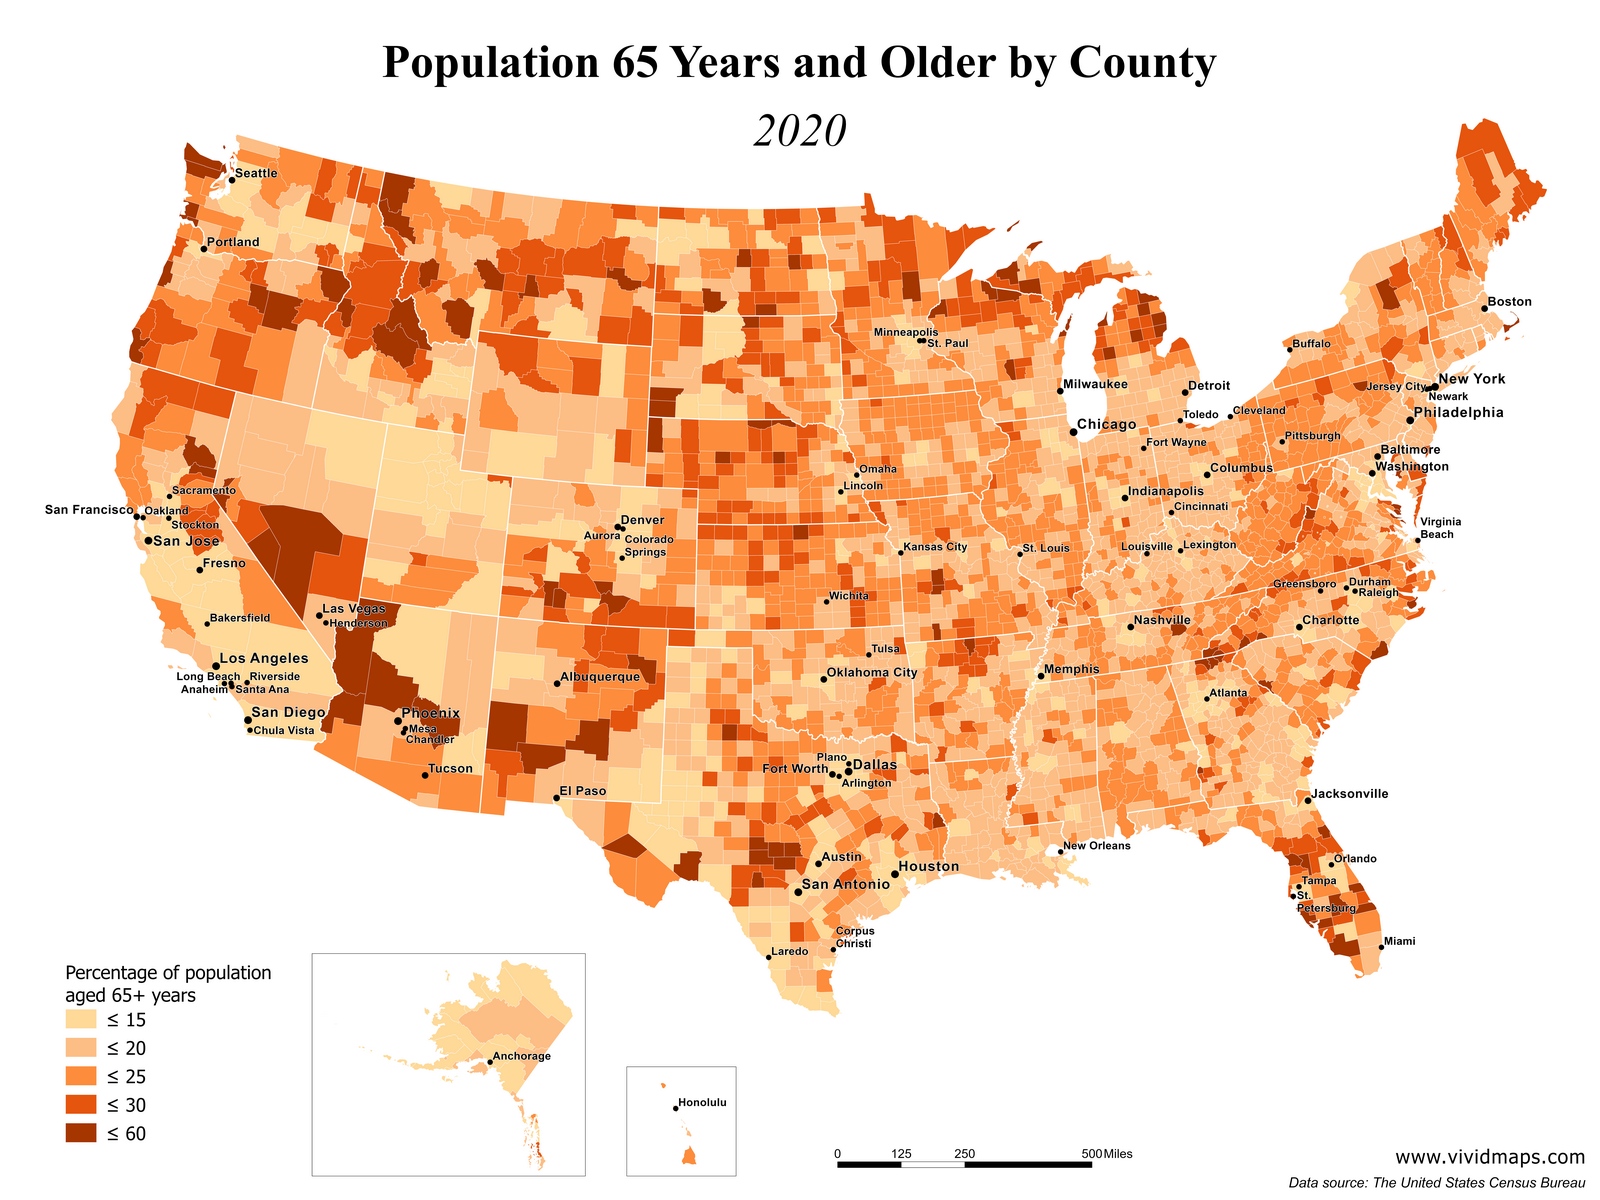
US population 65-years old
The highest percentage of senior citizens (2020):
Sumter (Florida) – 59.1
Kalawao (Hawaii) – 50.6
Catron (New Mexico) – 43.3
Harding (New Mexico) – 42.0
La Paz (Arizona) – 41.7
Charlotte (Florida) – 41.2
Jefferson (Washington) – 39.1
Ontonagon (Michigan) – 38.3
Northumberland (Virginia) – 38.0
Liano (Texas) – 37.9
The lowest percentage of senior citizens (2020):
Chattahoochee (Georgia) – 4.9
Wade Hampton (Alaska) – 6.6
Shannon (South Dakota) – 7.4
Todd (South Dakota) – 7.5
Madison (Idaho) – 7.5
Aleutians West (Alaska) – 7.8
Northwest Arctic (Alaska) – 7.8
North Slope (Alaska) – 8.0
Utah (Utah) – 8.2
Bethel (Alaska) – 8.5
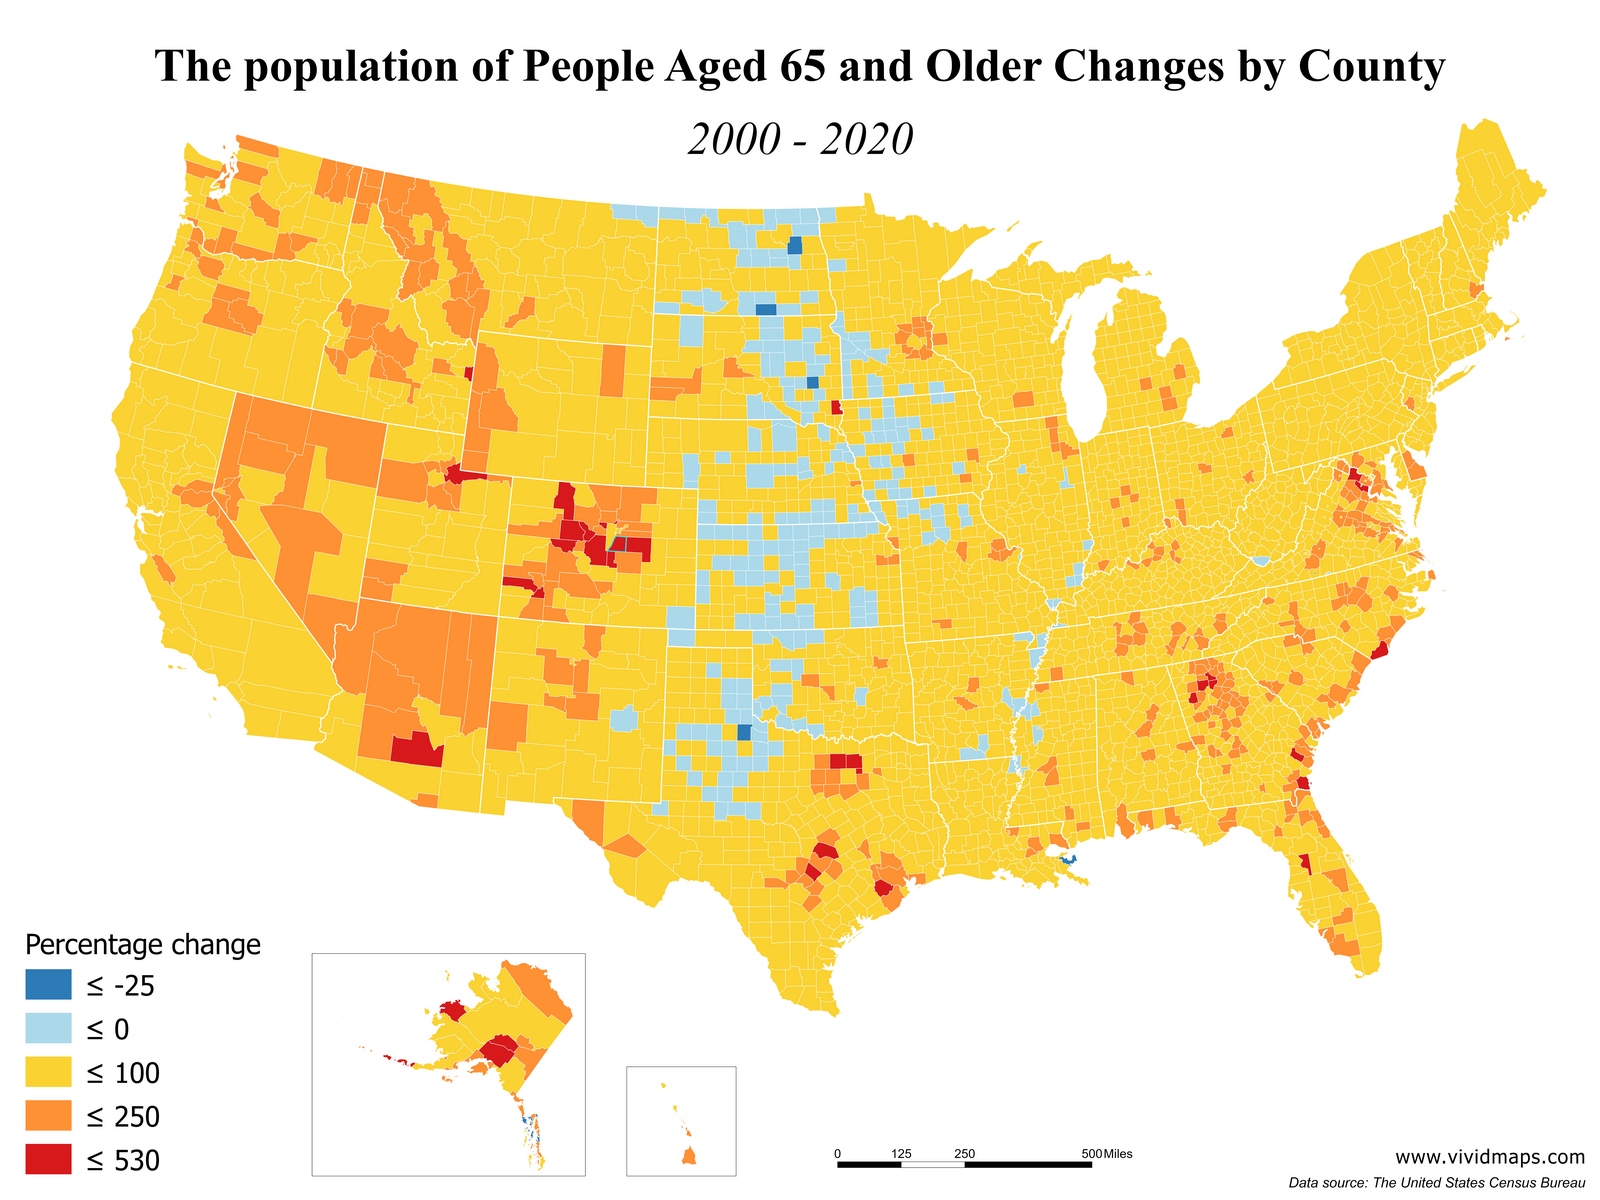
The map below shows the population aged 65 and older changes by U.S. county.
Between 2009 and 2019, the number of Americans aged 45-64 (who will reach age 65 over the next two decades) grew by 4%, from 80.3 million to 83.3 million.
According to U.S. Census Bureau, in 2019, the 65-74 age group population (31.5 million) was over 14 times larger than in 1900 (2,186,767); the 75-84 group (16 million) was 20 times larger (771,369), and the 85+ group (6.6 million) was over 53 times larger (122,362).
In 2019, 30 million women and 24.1 million men in America were 65 and older. That’s 125 women for every 100 men.
In 2020, a more significant percentage of older men (70%) than older women (48%) were married.
Since 1900, the percentage of Americans age 65 and older nearly quadrupled (from 4.1% in 1900 to 16% in 2019), and the number increased over 17 times (from 3.1 million to 54.1 million). The older population itself became increasingly more senior.
Here is the animated version of the map that shows the change of the American population 65 years and older by U.S. county from 2000 to 2020.
Thanks to improved living conditions and the development of health care in 2019, persons reaching age 65 had an average life expectancy of an added 19.6 years (20.8 years for women and 18.2 years for men). A child born in 2019 could expect to live 78.8 years, over 30 years longer than a child born in 1900 (47.3 years).
The older population is expected to continue to grow considerably in the future. Growth slowed somewhat during the 1990s because of the relatively small number of babies born during the Great Depression of the 1930s. But the older population is beginning to burgeon again as more than 2/5 (41%) of the “baby boom” generation are now age 65 and older.
The population aged 65 and older rose from 39.6 million in 2009 to 54.1 million in 2019 (a 36% growth) and is forecasted to reach 94.7 million in 2060. By 2040, about 80.8 million older persons will be more than twice as many as in 2000.
People aged 65 and older represented 16% of the population in 2019 but are predicted to grow to 21.6% of the population by 2040.


")
