Working Age Population in the U.S.
Nowadays, 64.8 percent of the United States population is of working age (15-64 years). According to the United States Federal Reserve, we have a 2020 national population of 331,449,281; we’re left with a working-age population of about 214.8 million.
Historically, the working-age population in the U.S. reached a record high of 207,501,350.7 in June 2022 and a record low of 135,150,444.7 in January 1977.
| Year | Share of population that’s Working Age, % | US Population | Total Working Age Population |
|---|---|---|---|
| 1970 | 61.9 | 203,211,926 | 125,788,182 |
| 1980 | 66.1 | 226,545,805 | 149,746,777 |
| 1990 | 65.8 | 248,709,873 | 163,651,096 |
| 2000 | 66.2 | 281,421,906 | 186,301,301 |
| 2010 | 67.1 | 308,745,538 | 207,168,256 |
| 2020 | 64.8 | 331,449,281 | 214,779,134 |
In percentage terms, America’s working-age population achieved its highest rate in 2006 and 2007, when 67.3 percent of the American population was of working age. As of 2020, 64.8 percent of the U.S. population is between 15-64 years.

U.S. counties that have the highest percentages of the working-age population (2020):
- Aleutians East (Alaska) – 83.15
- Aleutians West (Alaska) – 82.29
- Radford (Virginia) – 80.18
- Whitman (Washington) – 76.54
- Crowley (Colorado) – 76.39
- Stewart (Georgia) – 76.36
- Harrisonburg (Virginia) – 75.88
- Riley (Kansas) – 75.55
- Garza (Texas) – 75.15
- Lexington (Virginia) – 74.99
U.S. counties that have the lowest percentages of the working-age population (2020):
- Sumter (Florida) – 35.21
- Skagway-Hoonah-Angon (Alaska) – 38.91
- La Paz (Arizona) – 45.27
- Harding (New Mexico) – 46.87
- Catron (Nex Mexico) – 47.45
- Prairie (Montana) – 48.27
- Treasure (Montana) – 48.78
- Sierra (New Mexico) – 48.87
- Charlotte (Florida) – 49.29
- Kalawao (Hawaii) – 49.43
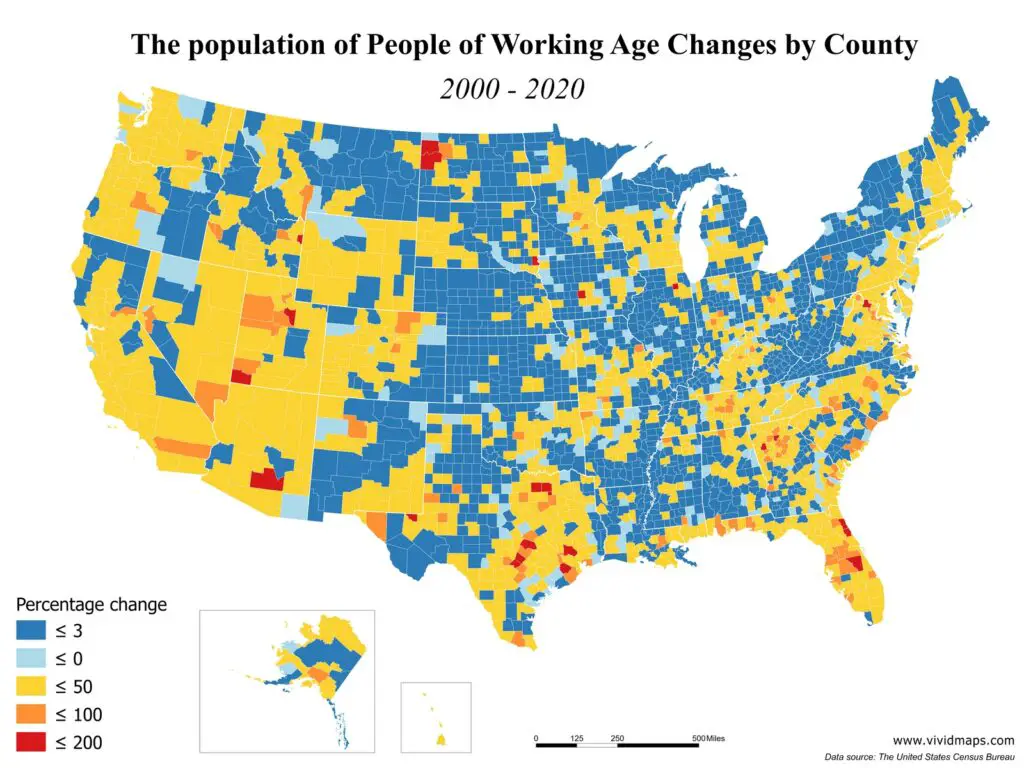
Below is the animated map that shows the change in the American population aged 15-64 years from 2000 to 2020.
America’s population is aging. Since 2010, the median age also rose from 37.2 to 38.4 years. In 2019, more than half the U.S. states had a median age greater than 38.4.
Over the last decade, the increase of the non-working-age population — ages 0 to 14 and 65 and older — has exceeded the growth of the working-age population.
Here is the map showing the working-age population changes by county from 2000 to 2020.
Interesting fact that the age group of 35-44 is the most employed. The labor force participation rate among this age group in the United States is 77 percent as of 2020. While the age group of 55 and over is the least employed. The labor force participation rate among this age group in the U.S. is 36.4% as of 2020.


My first impression is it shows the migration to the best or highest paying jobs.
he loss of working age persons is directly related to the legalization of abortion in 1973. Since then, between 800,000 and a million Americans were lost per year. In the last 20 years 25 million people of working age, between 20 and 45 years, are missing from our economy.
That decrease in number is also related to the housing crisis of 2007 when many of those workers would have entered housing market.
Steel production, the clothing and construction industries also suffered