In some cases, a U.S. state’s most populous city is not its capital. For instance, California’s most populous city is Los Angeles, not the capital Sacramento. Furthermore, Florida’s most populous city is Jacksonville, not Tallahassee. It is interesting to know more about each U.S. state’s population distribution; what percentage of its inhabitants live in the capital city?
According to Wikipedia, Phoenix in Arizona has the highest percentage of the state population residing there. Approximately 1.7 million people live in Phoenix, or about 23 percent of the total Arizona population. By difference, Sacramento in California, Tallahassee in Florida, and Albany in New York have less than 2 percent of the state population.
Percentage of U.S. state population living in the state capital
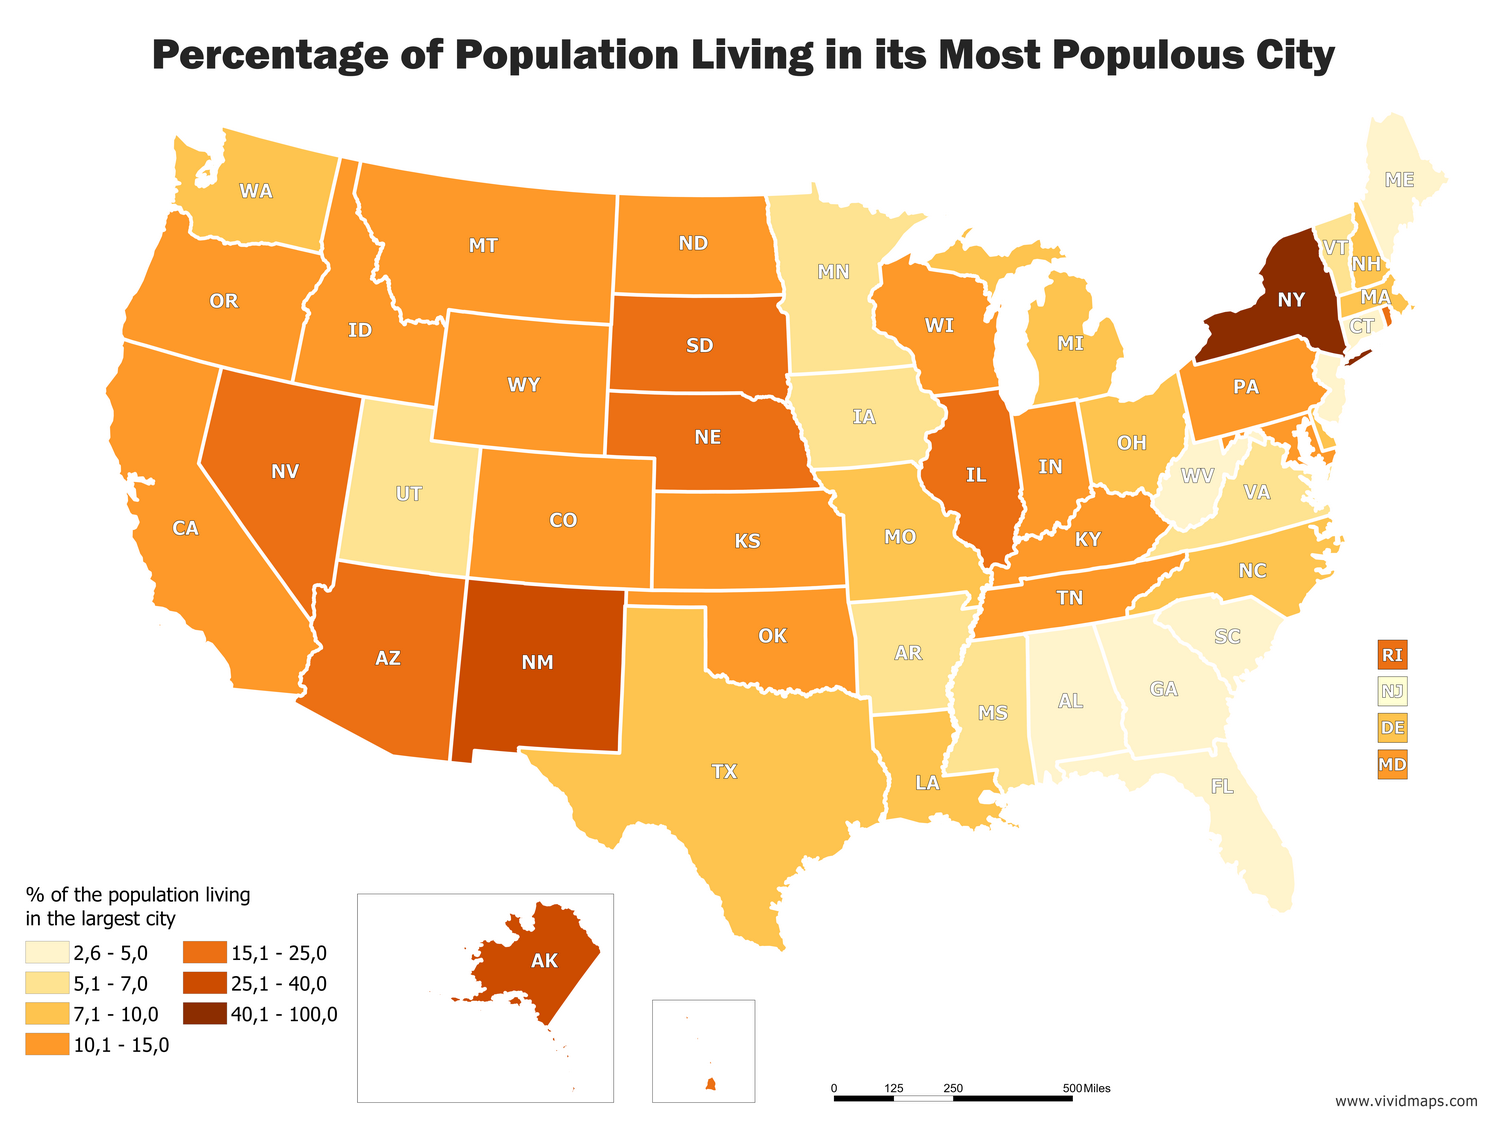
In most U.S. states, less than 20 percent of the population lives in the largest city. In South Carolina and West Virginia, even less than 3% of the population lives in the largest city. The highest percentage of the state’s population lives in New York City (New York) – 41.30% and Anchorage (Alaska) – 39.52%.
Percentage of Each U.S. State’s Population Living in its Most Populous City
State
Population
Largest City
Percentage
Alabama
4,858,979
212237
4.37%
Alaska
738.432
291826
39.52%
Arizona
6,828,065
1445632
21.17%
Arkansas
2,978,204
193524
6.50%
California
39,144,818
4792621
12.24%
Colorado
5,456,574
600158
11.00%
Connecticut
3,590,886
144229
4.02%
Delaware
945.934
70851
7.49%
Florida
20,271,272
880619
4.34%
Georgia
10,214,860
420003
4.11%
Hawaii
1,431,603
337256
23.56%
Idaho
1,654,930
205671
12.43%
Illinois
12,859,995
2695598
20.96%
Indiana
6,619,680
820445
12.39%
Iowa
3,123,899
215472
6.90%
Kansas
2,911,641
382368
13.13%
Kentucky
4,425,092
597337
13.50%
Louisiana
4,670,724
343829
7.36%
Maine
1,329,328
66194
4.98%
Maryland
6,006,401
620961
10.34%
Massachusetts
6,794,422
617594
9.09%
Michigan
9,922,576
713777
7.19%
Minnesota
5,489,594
382578
6.97%
Mississippi
2,992,333
173514
5.80%
Missouri
6,083,672
459787
7.56%
Montana
1,032,949
104170
10.08%
Nebraska
1,896,190
408958
21.57%
Nevada
2,890,845
583756
20.19%
New Hampshire
1,330,608
109565
8.23%
New Jersey
8,958,013
277140
3.09%
New Mexico
2,085,109
545852
26.18%
New York
19,795,791
8175133
41.30%
North Carolina
10,042,802
731424
7.28%
North Dakota
756.927
105549
13.94%
Ohio
11,613,423
879170
7.57%
Oklahoma
3,911,338
579999
14.83%
Oregon
4,028,977
583776
14.49%
Pennsylvania
12,802,503
1526006
11.92%
Rhode Island
1,056,298
178042
16.86%
South Carolina
4,896,146
129272
2.64%
South Dakota
858.469
153888
17.93%
Tennessee
6,600,299
660388
10.01%
Texas
27,469,114
2099451
7.64%
Utah
2,995,919
186440
6.22%
Vermont
626.042
42417
6.78%
Virginia
8,382,993
437994
5.22%
Washington
7,170,351
608660
8.49%
West Virginia
1,844,128
51400
2.79%
Wisconsin
5,771,337
594833
10.31%
Wyoming
586.107
59466
10.15%
Which U.S. states are actually city states?
If you take metro areas into account, in 18 U.S. states, over half of the state’s population is located in one metro area. These states in the United States are actually city-states.


How Much of Each State Lives in the Biggest County?
Phoenix just grows and grows.