Manhattan has always been unique in New York City. Take a map of the five boroughs and Manhattan is the smallest one—yet somehow it holds more people per square mile than any other part of the city. In 2025, about 1.7 million peoplelive here, packed into 22 square miles (57 square kilometers). That’s something like 77,000 people per square mile, or around 30,000 per square kilometer. No other county in America comes close. But you want to see real density? Look at Manhattan in 1910. Ships were unloading immigrants from Europe every week. Most jobs were downtown or in Midtown. If you didn’t live within walking distance, you weren’t getting to work. So the island absorbed around 2.3 million people—about 101,000 per square mile, or 39,000 per square kilometer.
So what changed? The city spread out. The Brooklyn Bridge changed things. Then came the subway expansions into the Bronx and Queens. Suddenly a worker making $15 a week didn’t have to pay half of it for a windowless room in the Bowery. Astoria was an option. So was Flatbush. You could get to work in 45 minutes instead of living on top of it. Families who’d been stuffed into one-bedroom tenements—three kids, two adults, maybe a boarder—started leaving for places with actual space. A second bedroom. A patch of grass. Windows that looked out at something besides a brick wall three feet away. Manhattan kept building upward—the Woolworth Building, the Chrysler, the Empire State—but not homes. Those were offices.
Homes that had once held entire families were later converted into larger single units. The result was fewer residents overall, even though the skyline was rising higher than ever.
By 2010, the resident population had dropped to about 1.59 million, far below the 1910 peak. Yet in the past two decades, Manhattan has started to grow again. According to recent city estimates, its population in 2025 is close to 1.7 million. The numbers are creeping back up, slowly but steadily, even with rents that make your eyes water.
The shifts look like this:
Year
Population
Density per km²
Density per mi²
1910
~2,300,000
~39,208
~101,500
2010
1,585,873
~26,830
~69,500
2025
~1,694,251
~28,670
~74,250
This table shows how Manhattan has never gone back to the density of its early 20th-century peak, even though it remains the densest part of the United States.
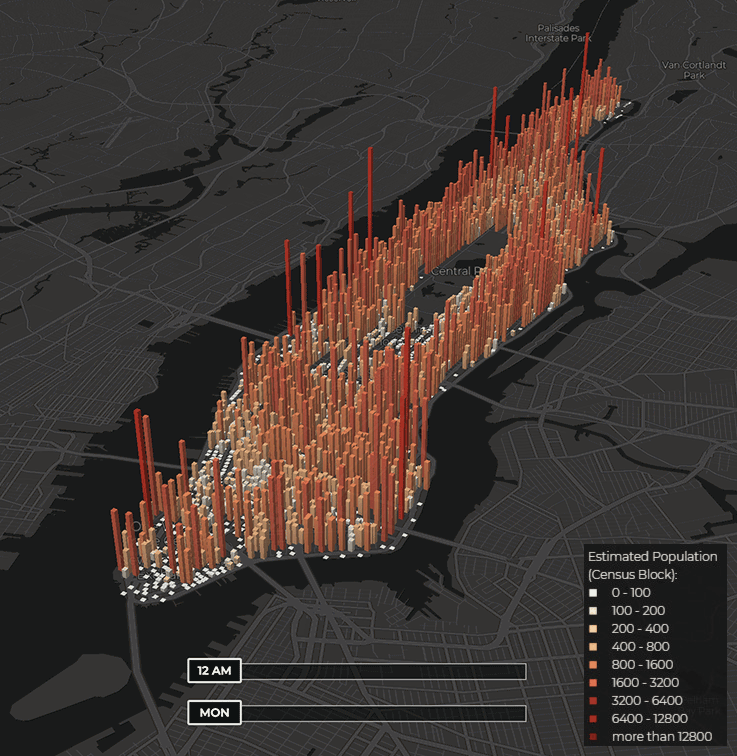
But what makes Manhattan even more interesting today is that its population doesn’t just change across decades—it also shifts dramatically within a single day. Thanks to a project called manpopex.us, you can actually see these changes block by block and hour by hour. The estimates combine census data with subway entry and exit counts, balanced against studies from NYU Wagner.
According to that research, Manhattan holds about two million people overnight. Around lunchtime on a typical weekday, you’re looking at nearly double that—close to four million. The peak usually hits on Wednesday afternoons around 2 p.m.—Midtown gets so jammed you can barely move on the sidewalks, and good luck finding a table at any restaurant. Then flip to late Sunday night and the contrast is wild. The streets empty out, the subways run nearly vacant, and everything feels strangely still before the whole cycle starts over Monday morning.
The change isn’t spread evenly. Go north of Central Park and you’ll find neighborhoods that actually empty out during the day—people heading off to jobs elsewhere in the city. Head downtown and it’s a completely different story. Midtown and the Financial District pack in so many workers and visitors that the density rivals what you’d see in the most crowded parts of Mumbai or Macau. Weekends are their own thing. You get fewer commuters, sure, but nightlife and tourism keep the population up later than you’d expect—definitely later than on weeknights.
That 1910 number—2.3 million residents—probably isn’t coming back. Ever try standing in Times Square on a Wednesday afternoon, though? You’d swear Manhattan was the most packed place on the planet. Here’s the thing: the island doesn’t grow the way it used to, slowly adding people decade after decade. Now it’s all about the daily cycle—people flood in each morning, then pour back out at night. That rhythm tells you more about Manhattan than any census ever could.