Animated map shows Sydney’s 250-year evolution in 30 seconds
It’s been less than 250 years since the First Fleet of 1,485 settlers first arrived in New South Wales on January 26, 1788 – a date we now celebrate annually as Australia Day.
In that relatively short time, Sydney has developed into one of the world’s largest, most cosmopolitan cities, with a population of over 5 million and a unique mix of Aboriginal, British, Asian, and European cultural influences.
To get a better understanding of how Sydney became the modern metropolis it is today, Budget Direct Travel Insurance analyzed dozens of maps of Sydney from the National Library of Australia and other sources from the years 1770-2020. Research in hand, the team created an animated map to show how the city has grown.
In its relatively short history, Sydney experienced near starvation, rebellion attempts, a gold rush, trade booms, the Great Depression, two world wars, and hosted the Summer Olympics. These maps depict the major infrastructural, architectural, and demographic developments that resulted from these dynamic periods in Sydney’s rich history. Additionally, some of the older maps were chosen for their historical significance and the important role they played in the early settlement of the city.
James Cook’s landing at Sting-Ray Bay (Botany Bay). First plan of “Sting-Ray Bay”, 1770

Map of the penal colony in Sydney Cove, 1788

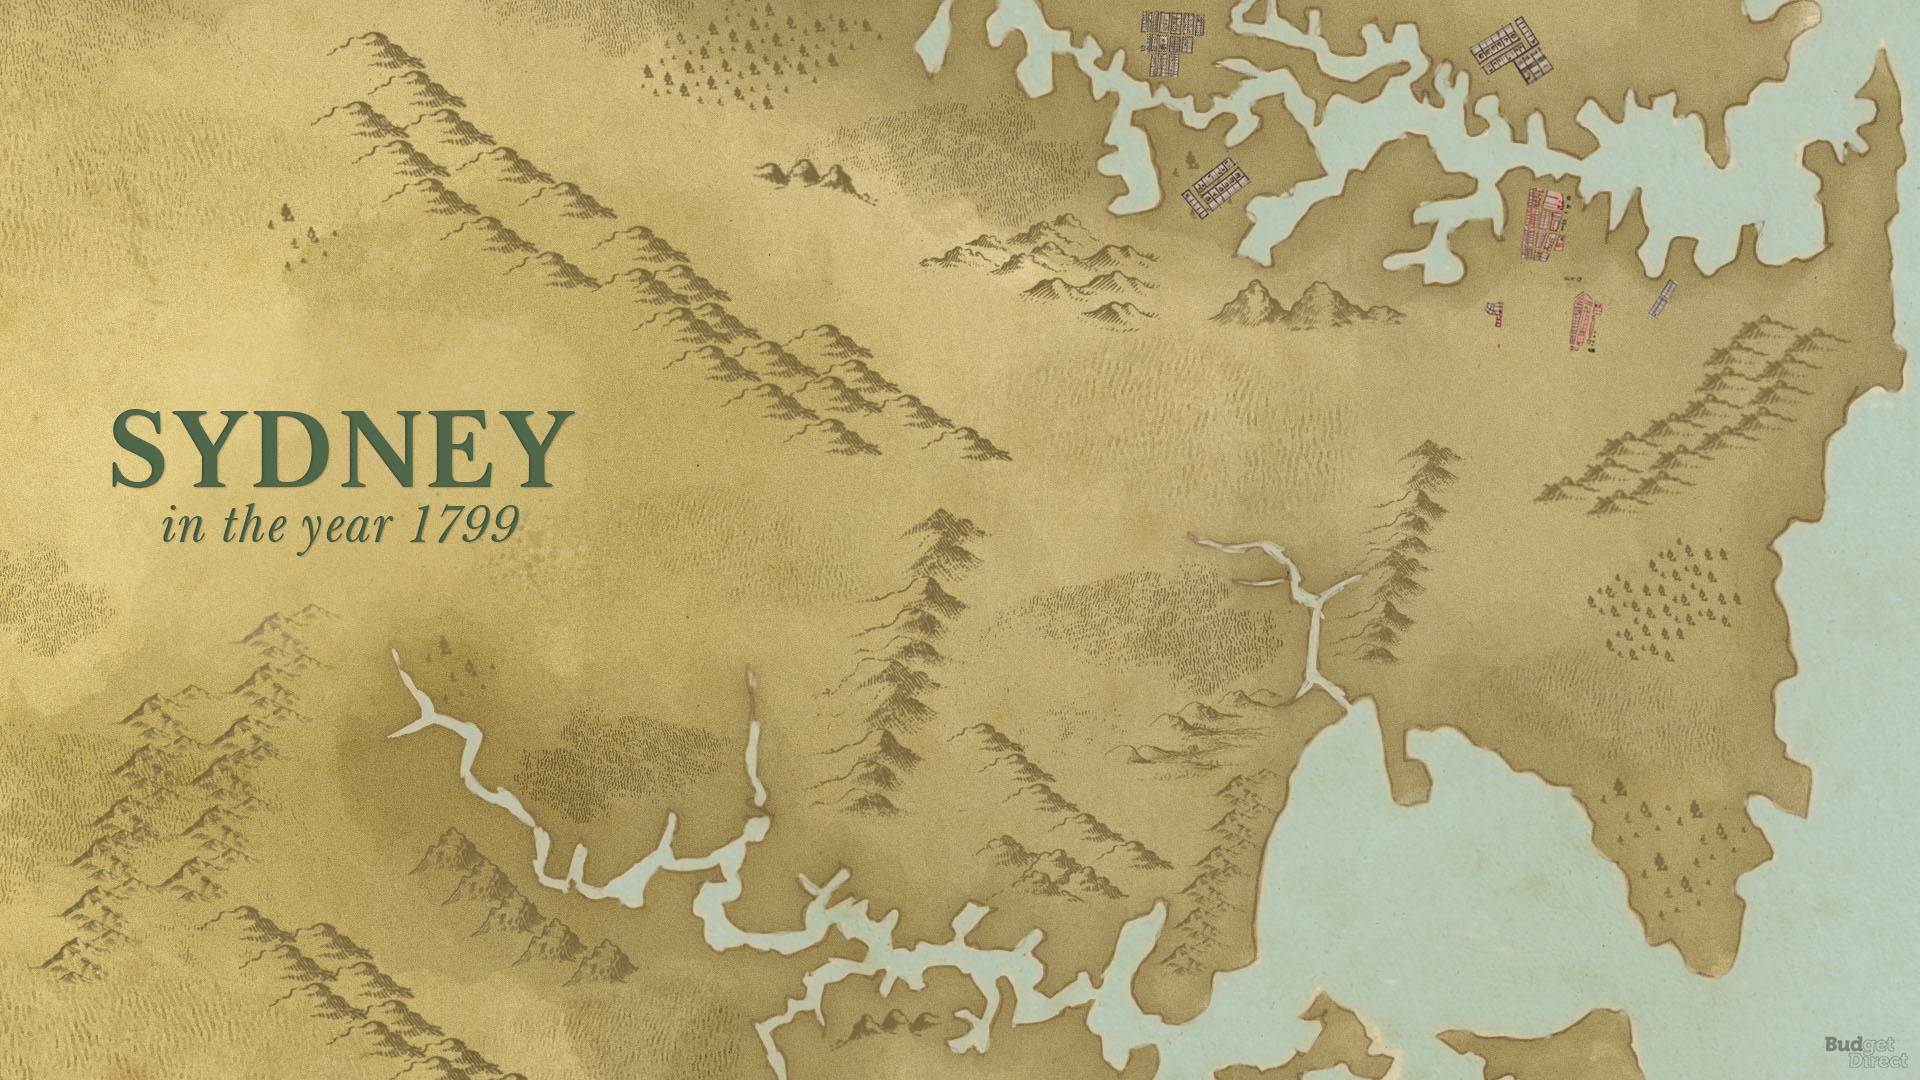
A plan of the civilian settlements of New South Wales, 1799
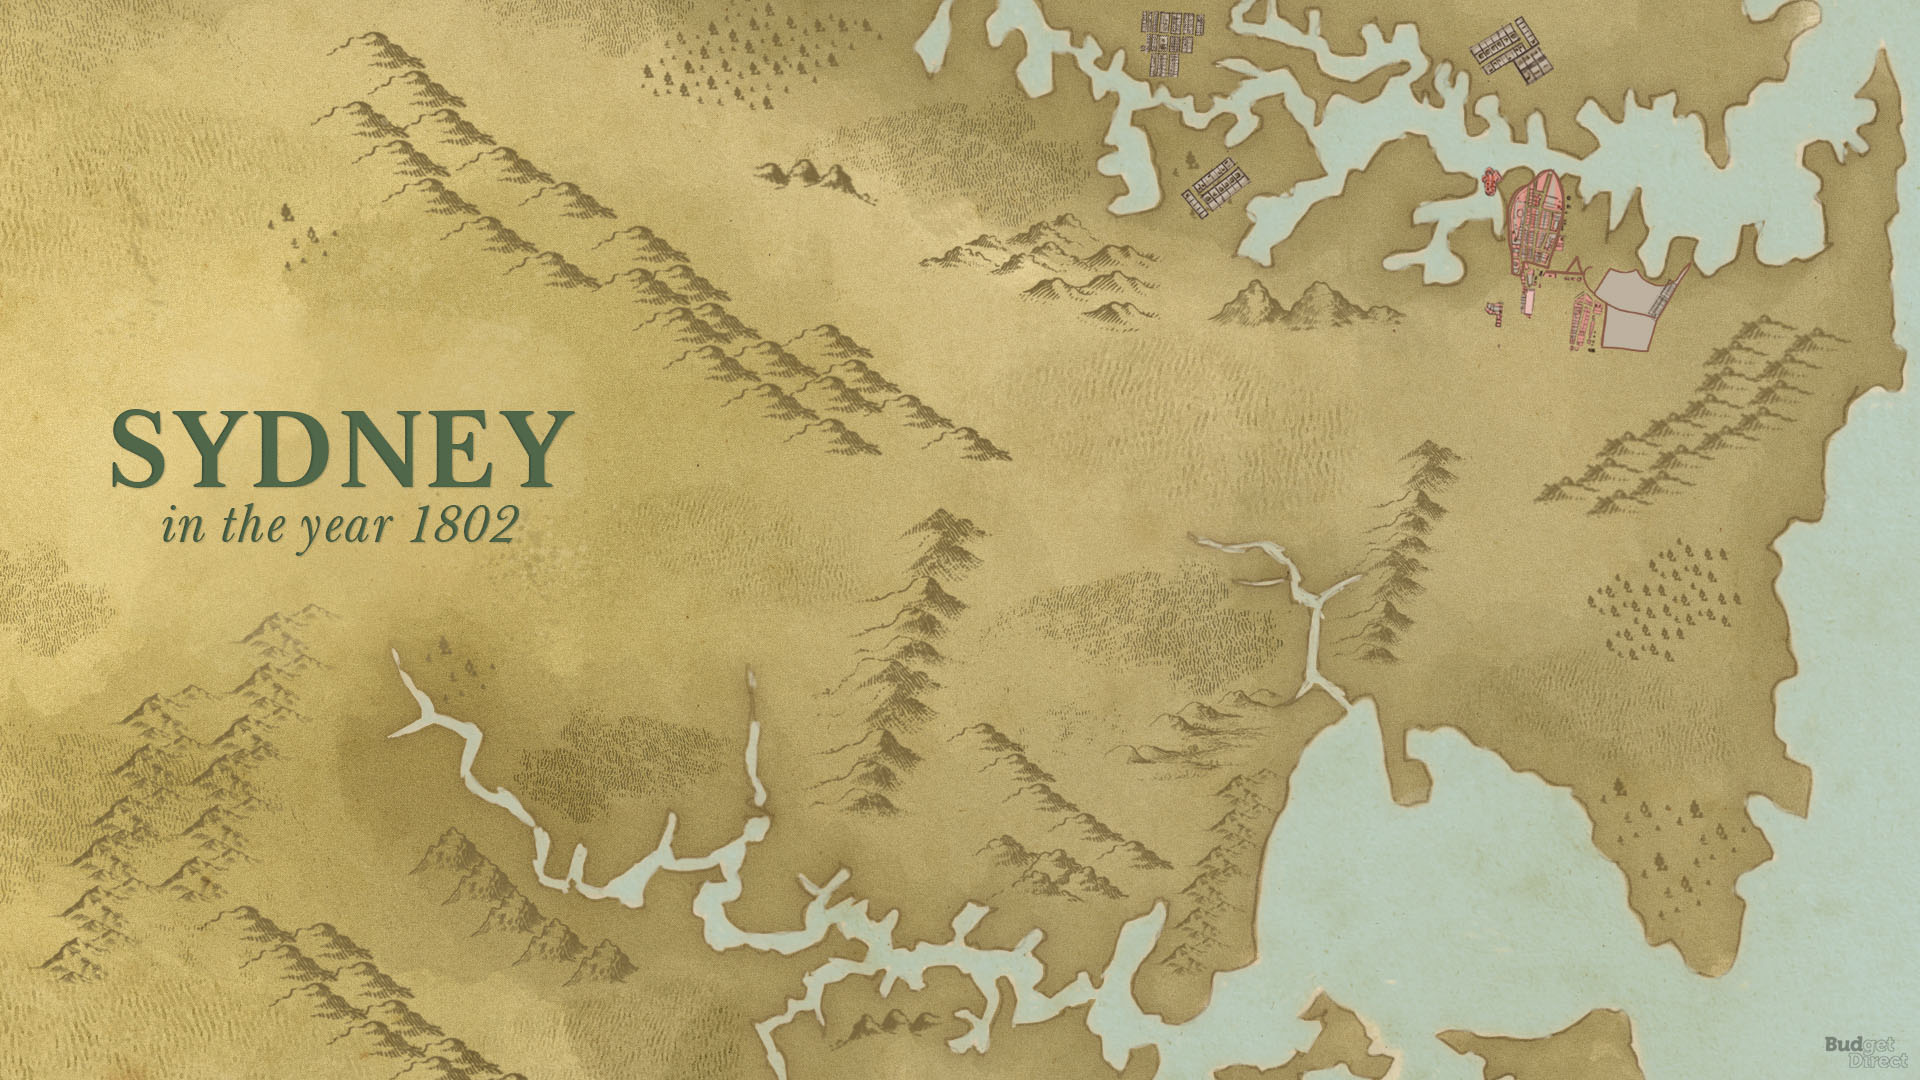
Plan drawn by Charles Alexandre Lesueur during the French scientific expedition, 1802
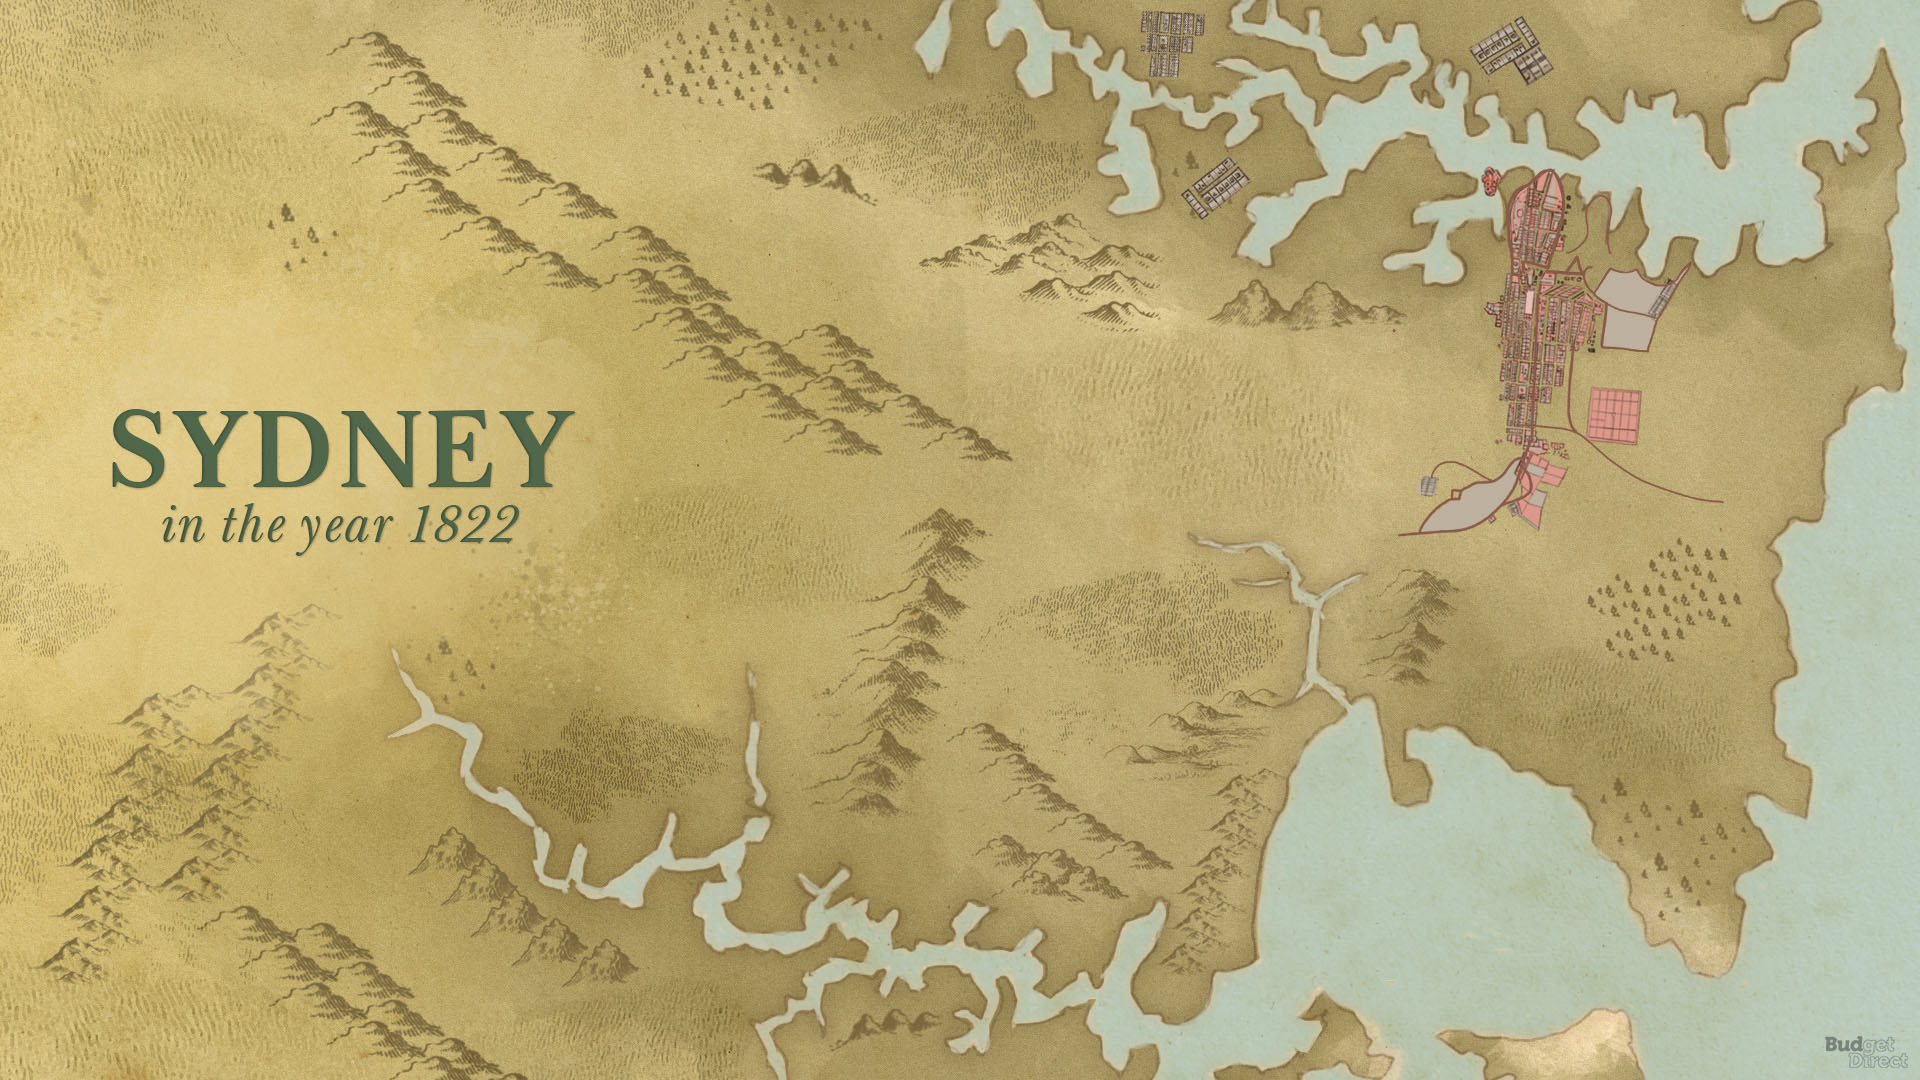
Map that captures the transformation of a penal colony into a city, 1822
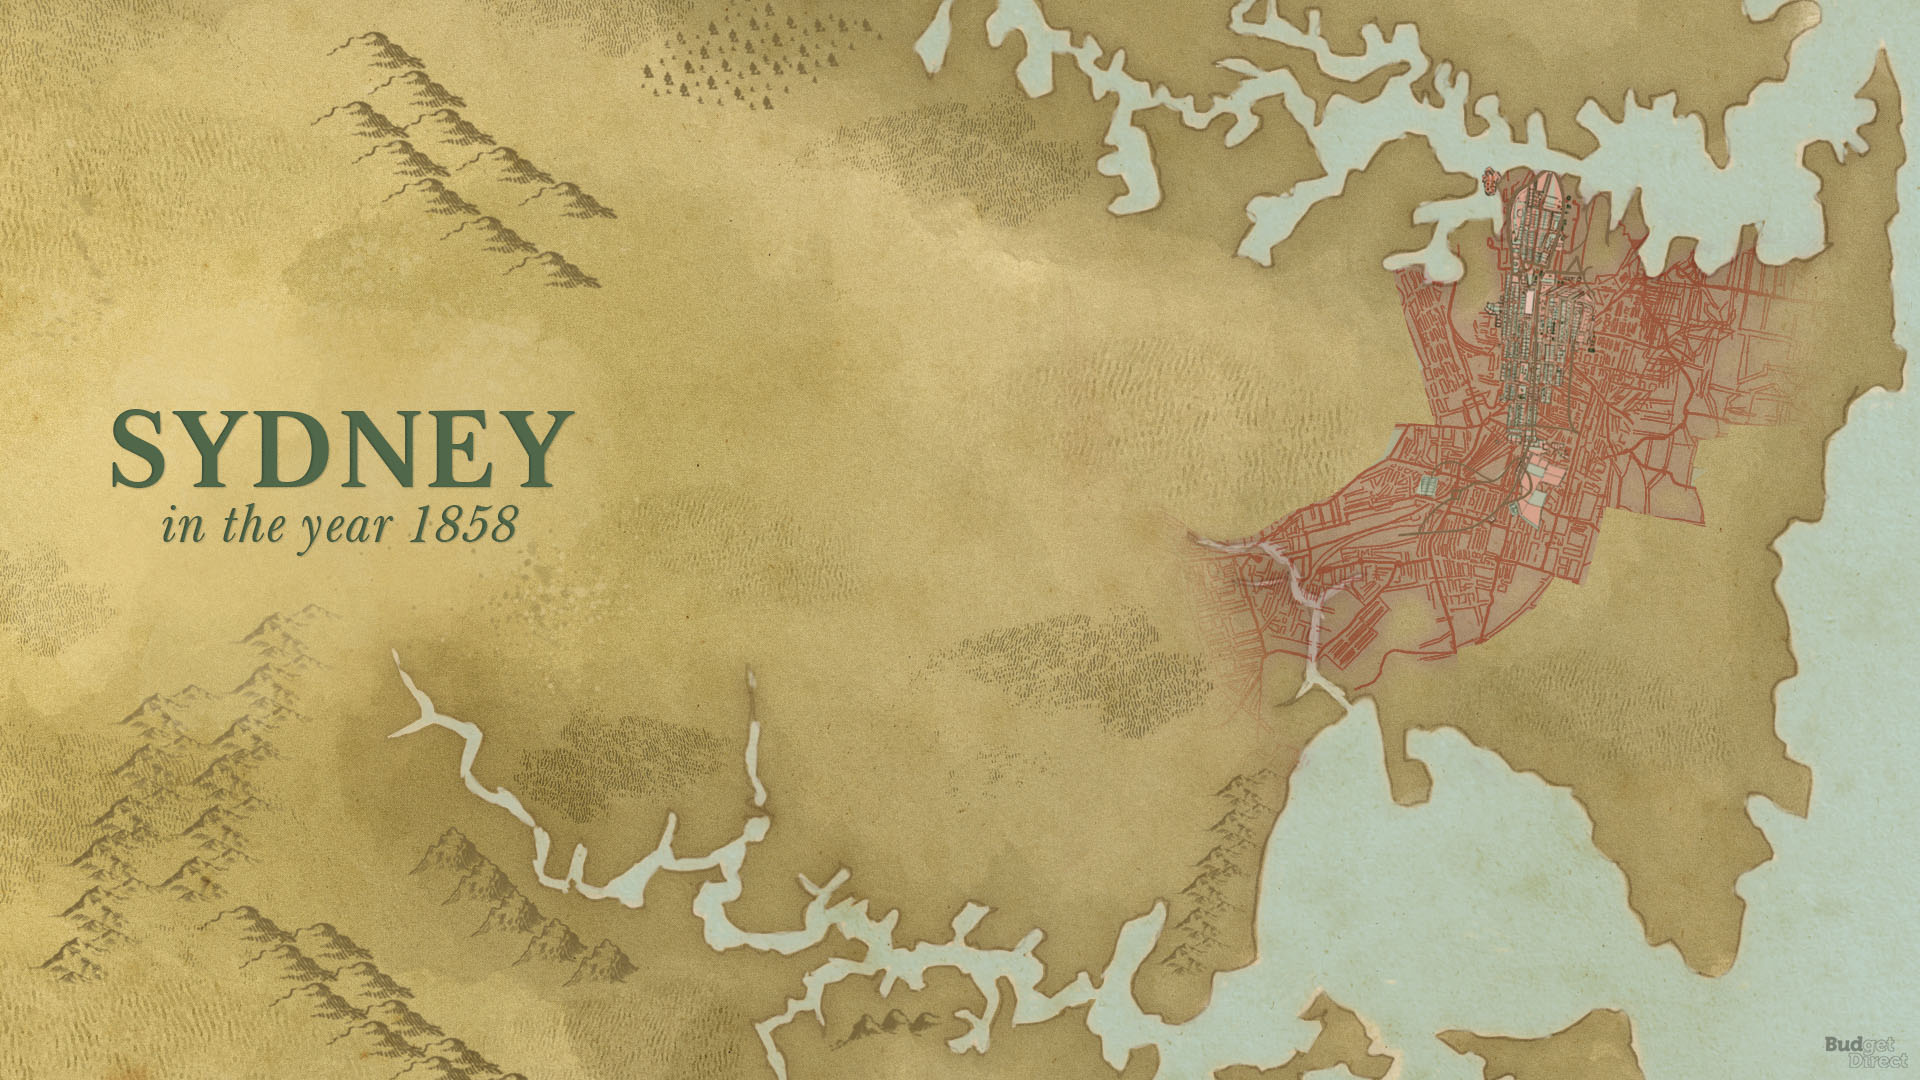
The city during the gold rush, 1858
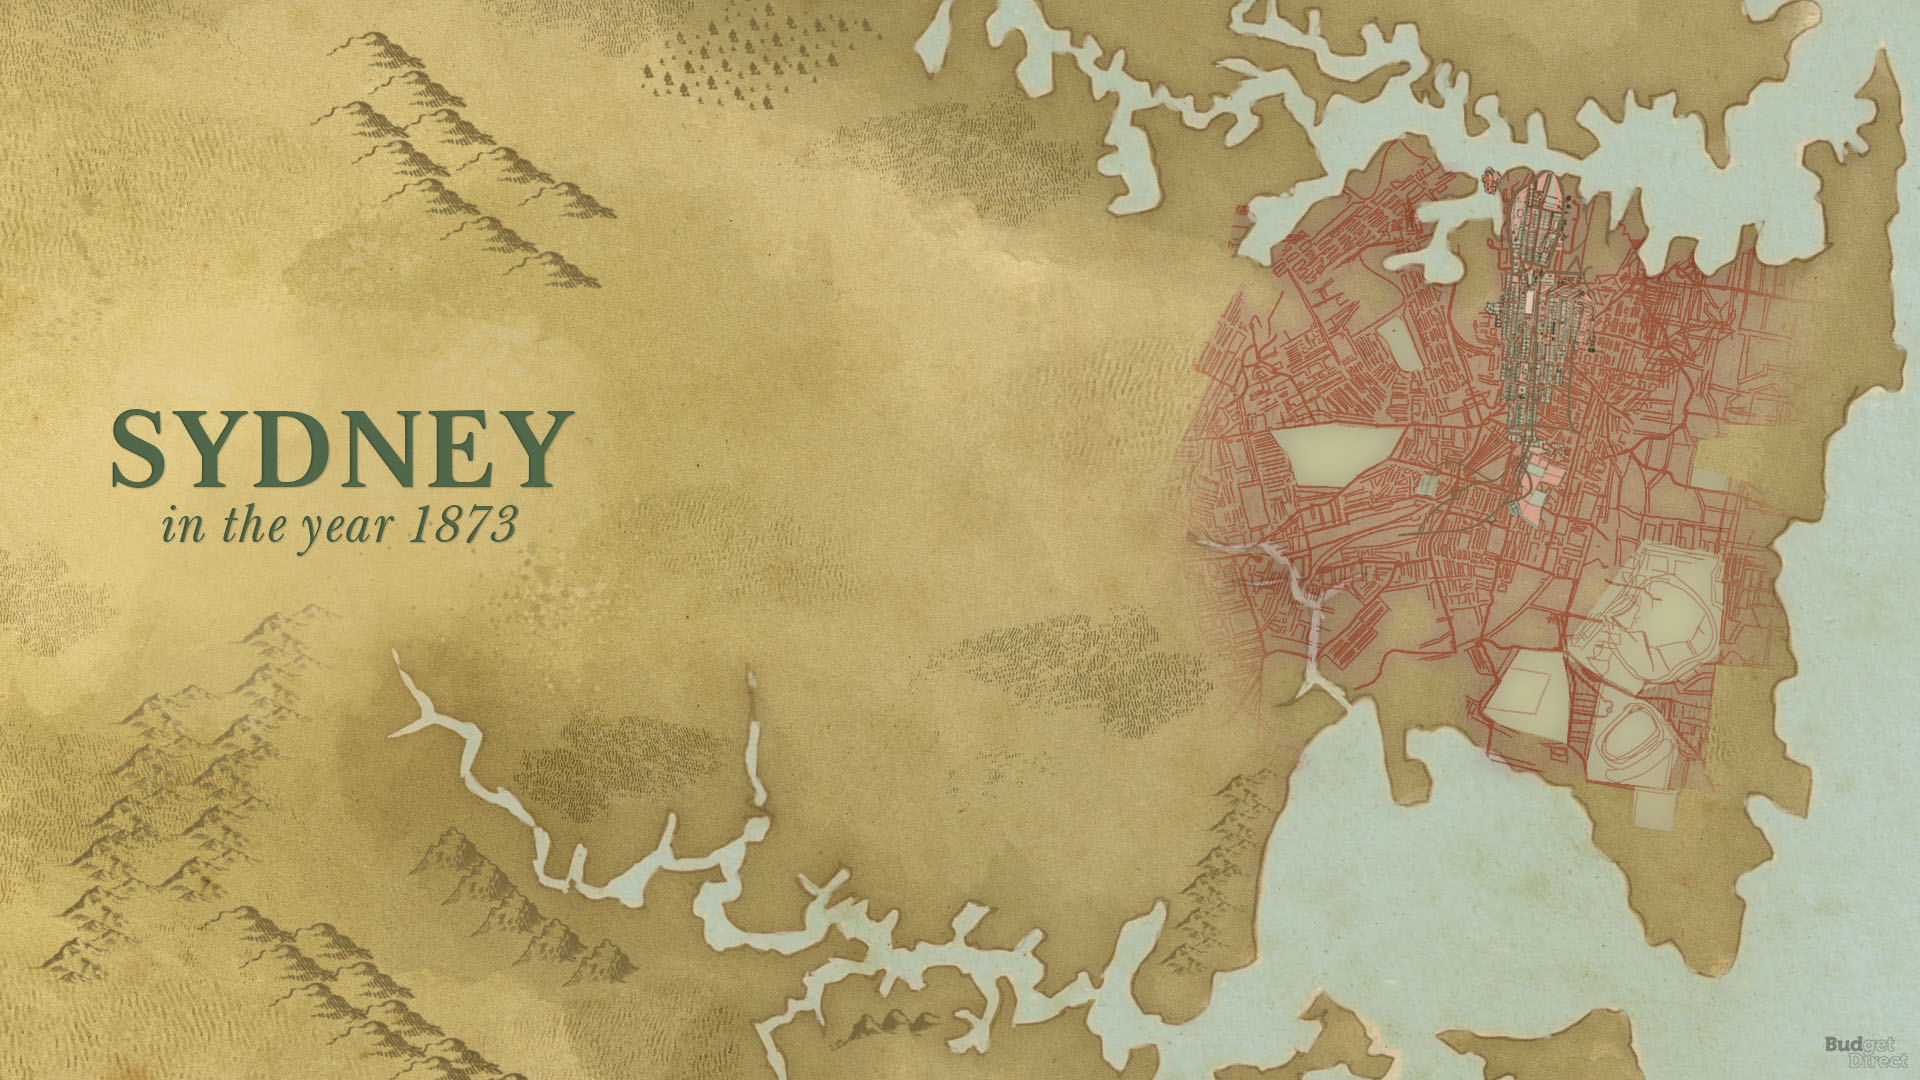
The map printed in Sydney Mail magazine showing the growth of Sydney from 1802 to 1873
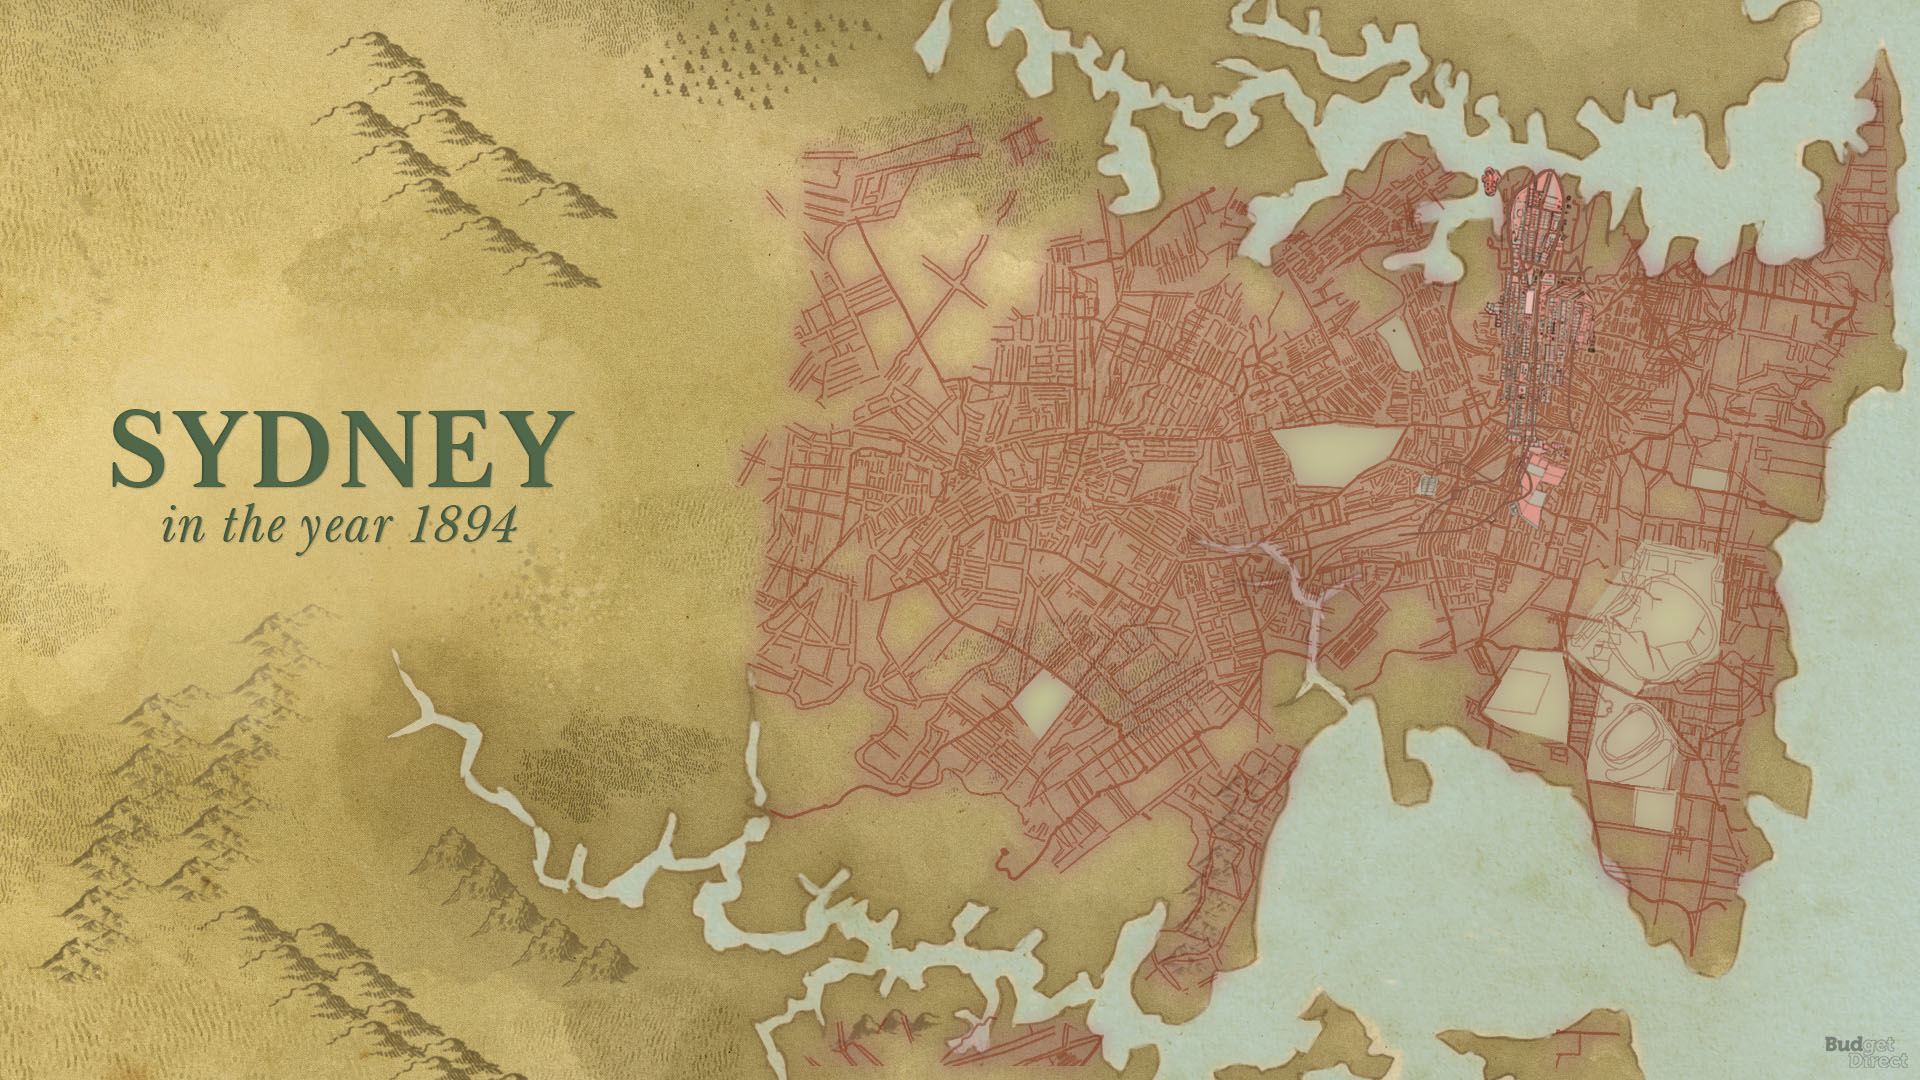
The mapping first tram system of the city, 1894
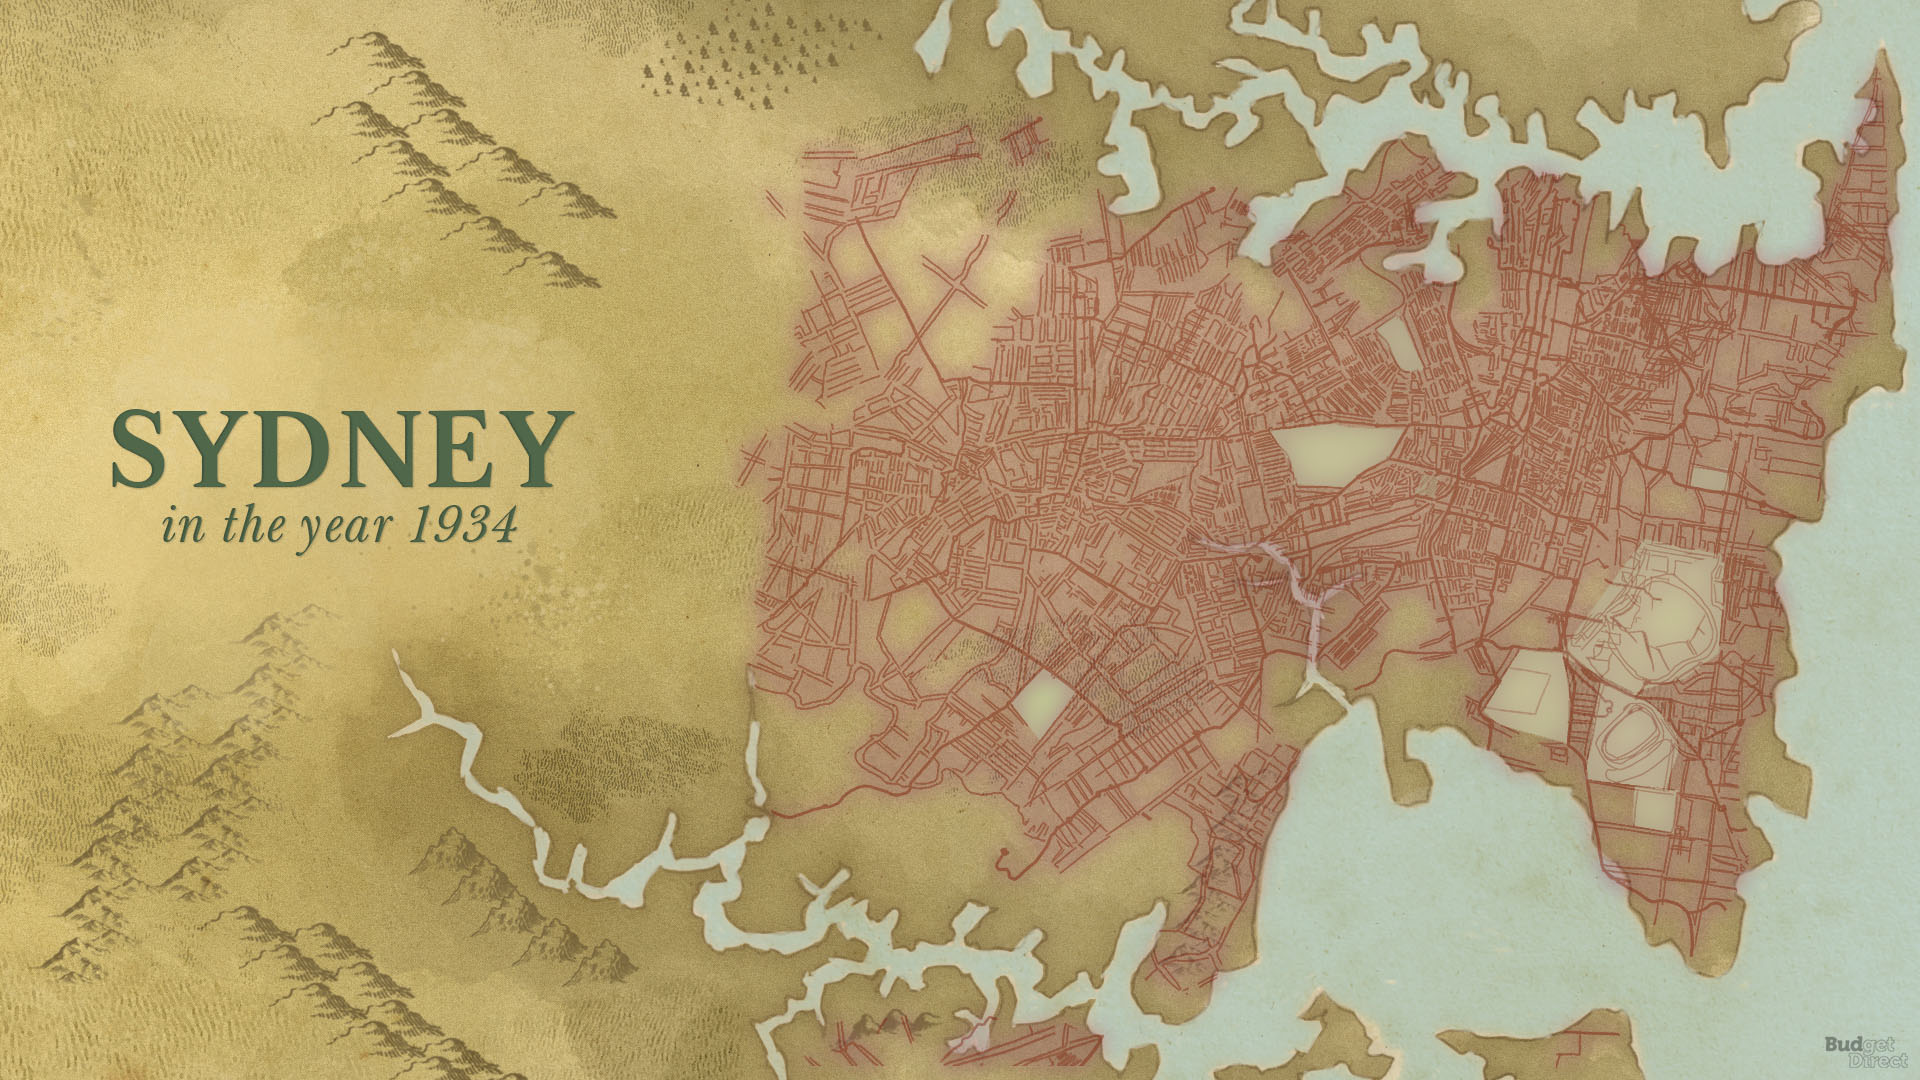
Gregory’s Sydney Street Directory, 1934
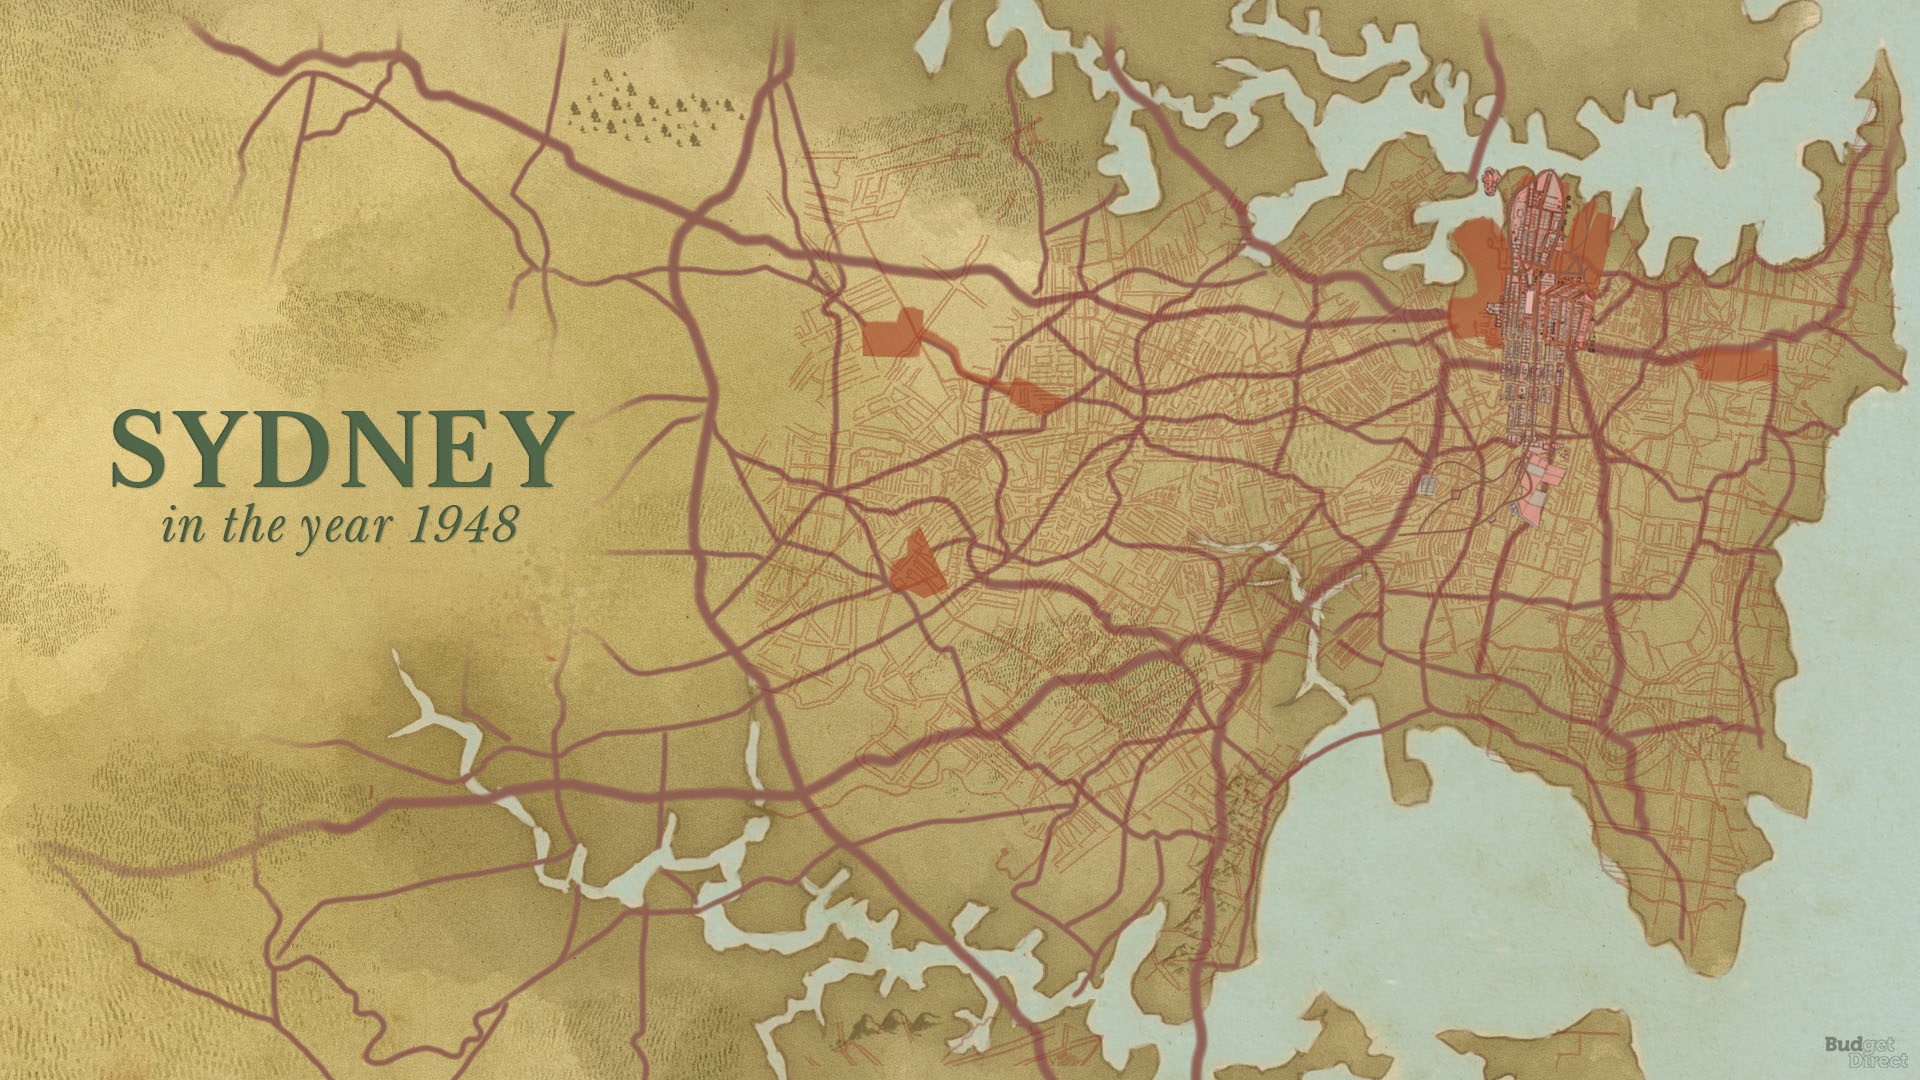
Plan of green belt and radial freeway system around Greater Sydney, 1948
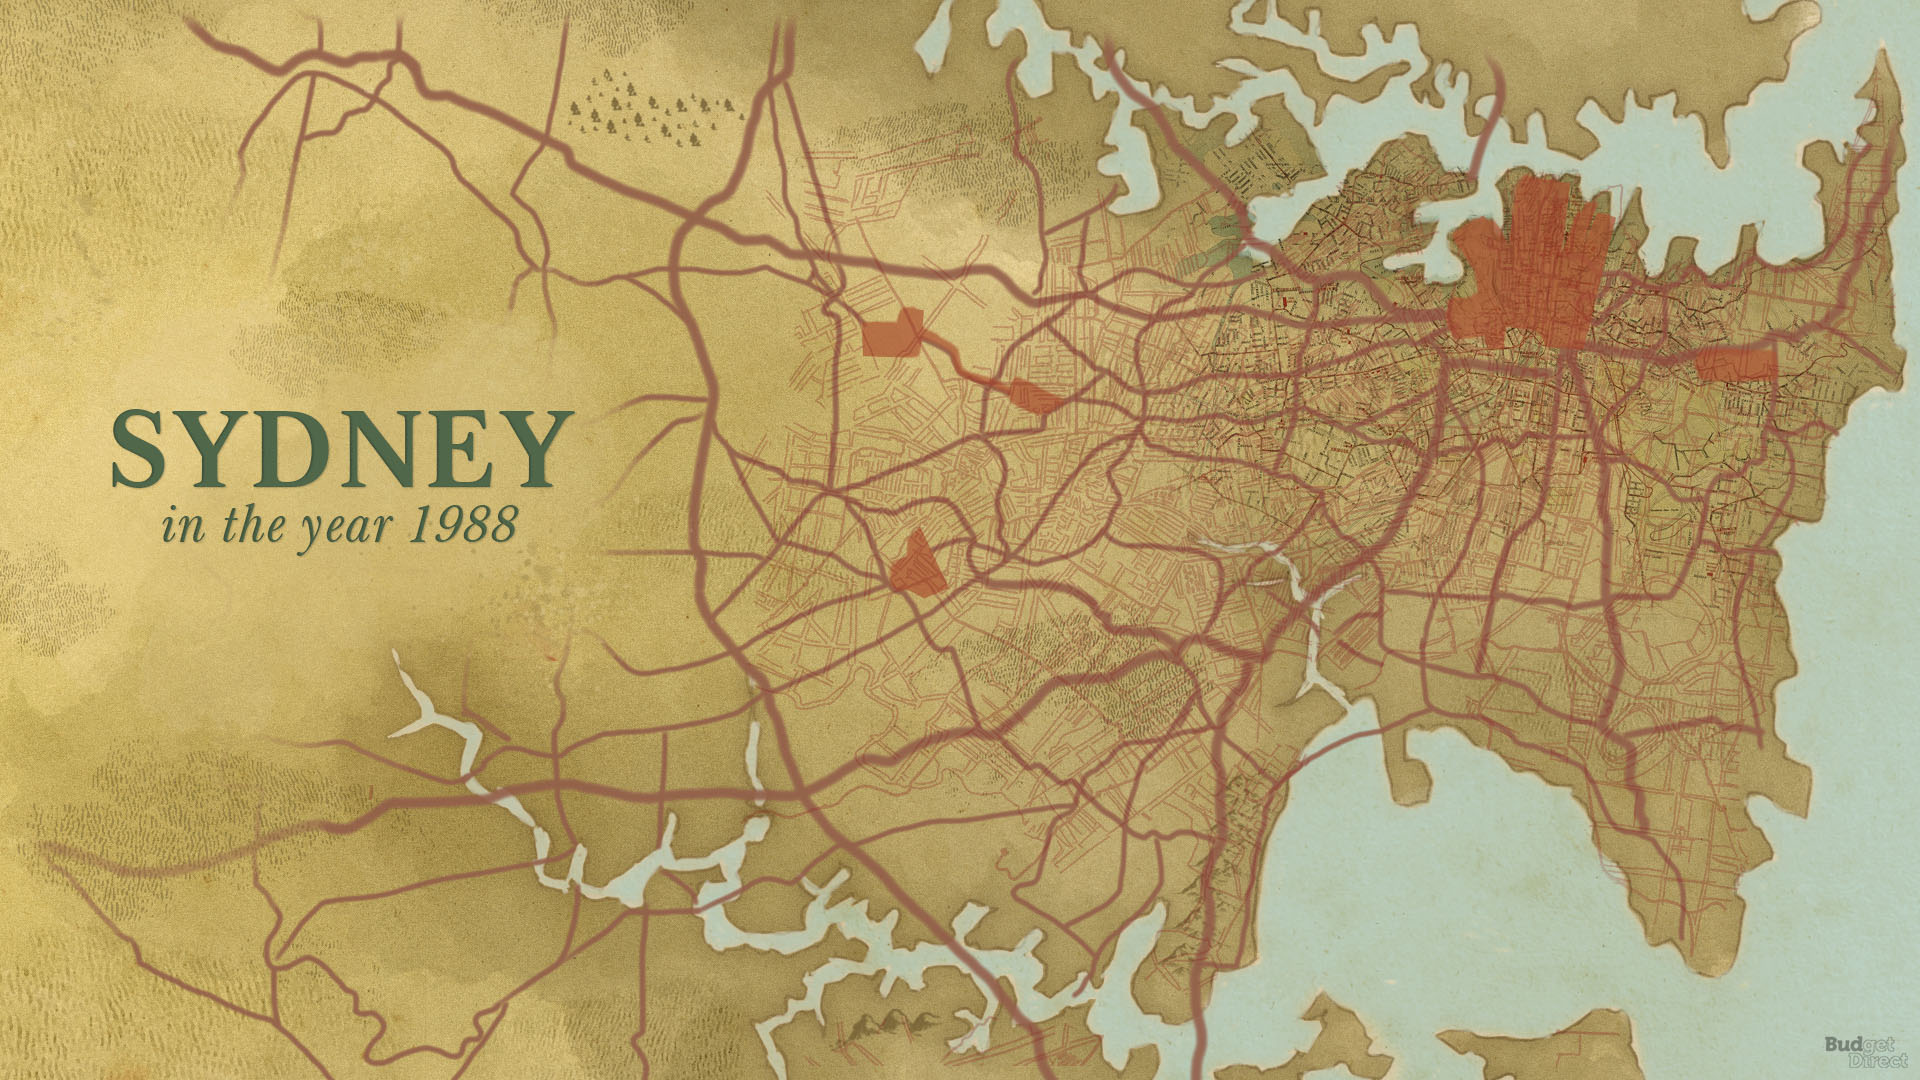
New city plan “Sydney Into Its Third Century”, 1988
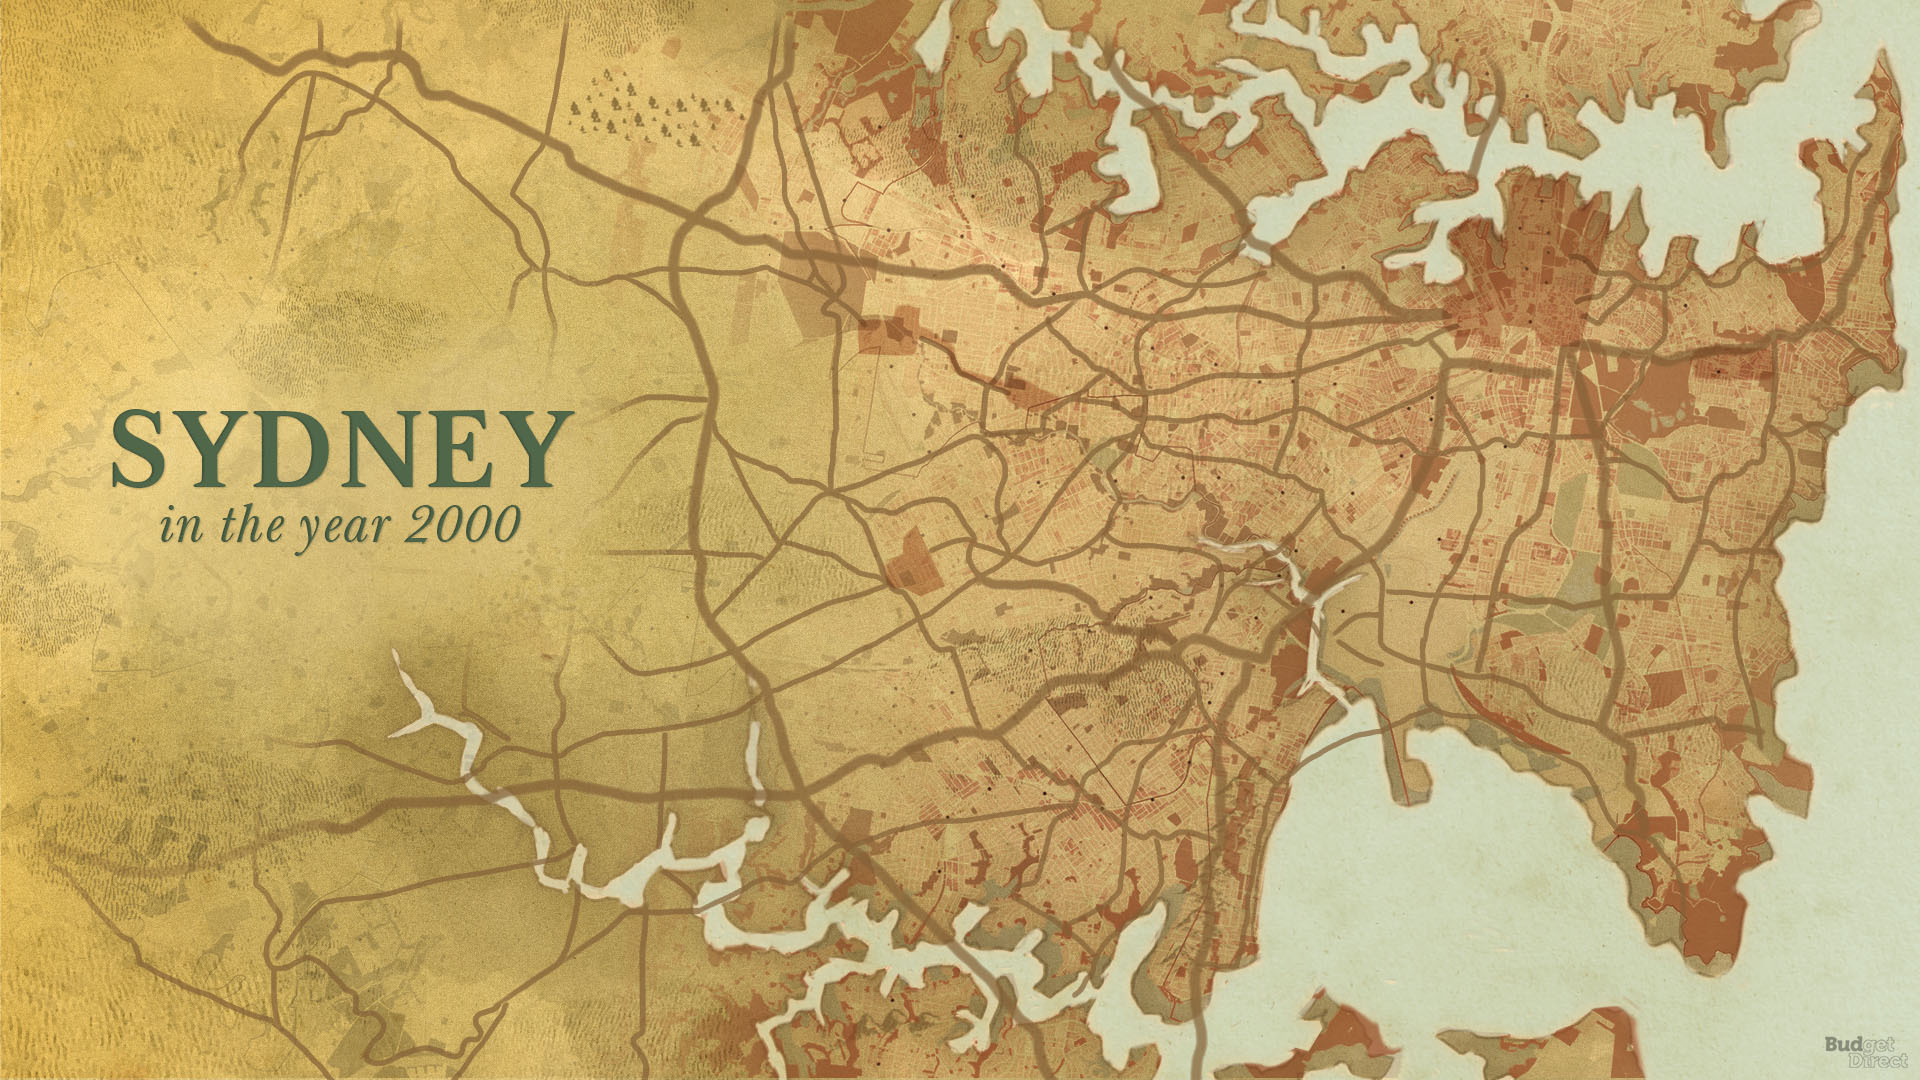
Infrastructural impact of the Olympic Games on the City, 2000
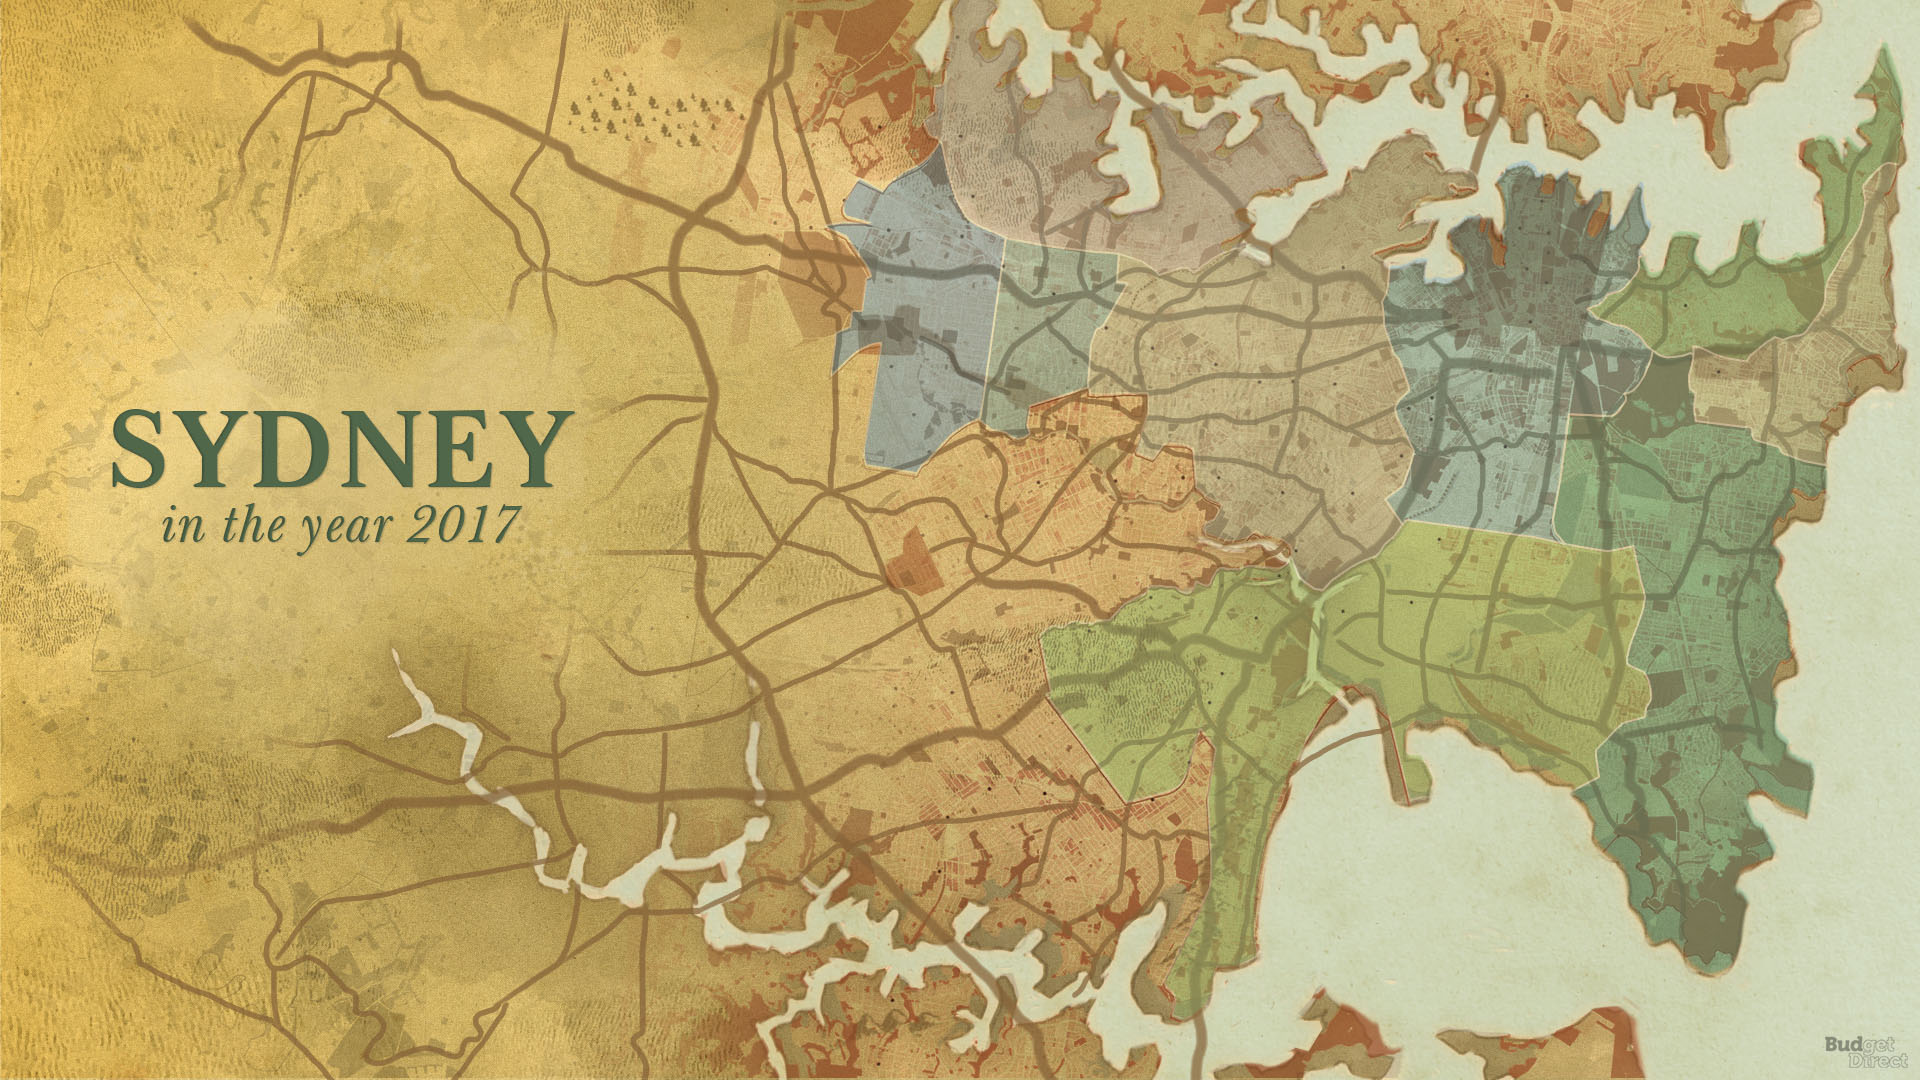
Sidney Green Grid, 2017
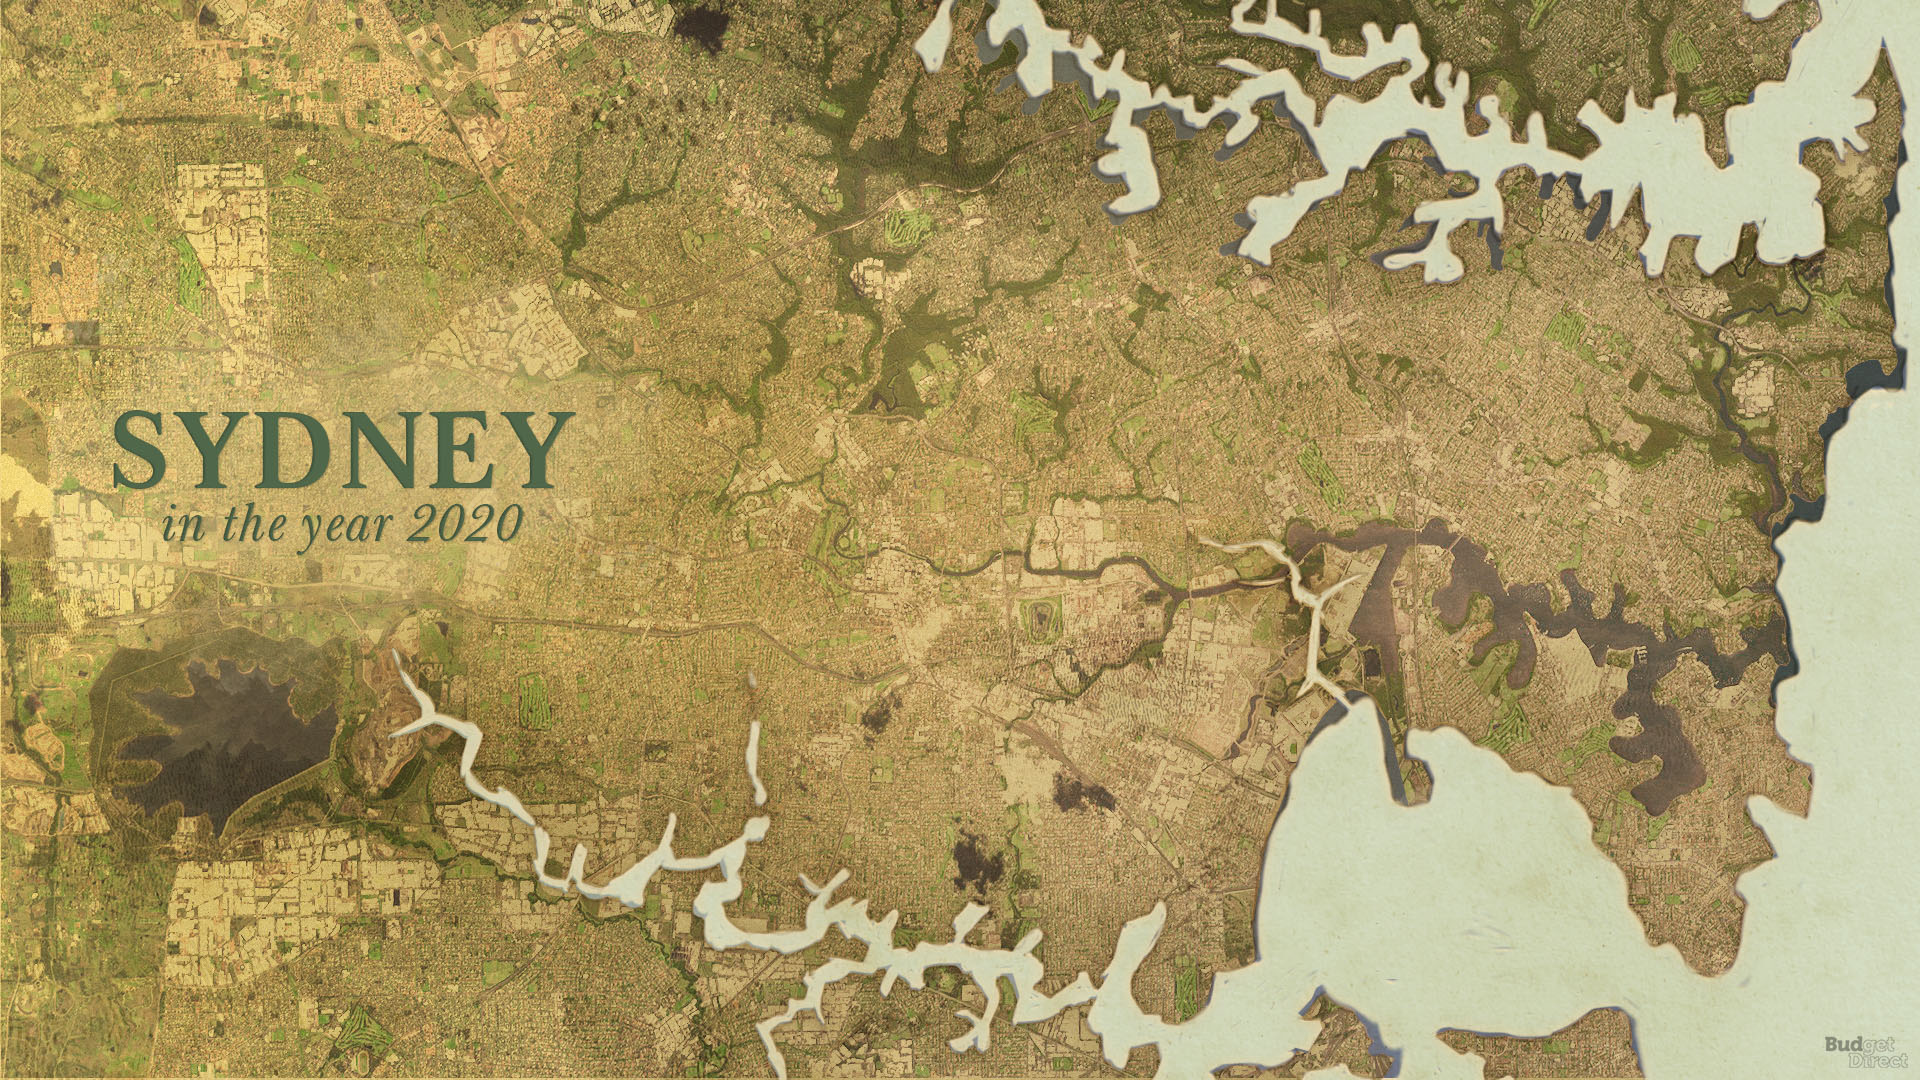
Sydney in the year 2020
Methodology: Budget Direct analyzed over a dozen maps of Sydney from the National Library of Australia and other sources from the years 1770 to 2020. The team identified important buildings and infrastructural developments in the city’s history using information from the Office of Environment & Heritage of the Government of New South Wales, Sydney history and travel guides, and other sources, and identified maps that best reflect those changes. Budget Direct then designed their own maps combining info and features from the historical maps – and incorporated these into one animation.
To learn more about Sydney have a look at the following books:


