The largest company headquartered in each U.S. state
The map below, created by caprelo.com using Forbes data, shows the largest company headquartered in each state (based on worldwide
Read MoreMaps of the US
The map below, created by caprelo.com using Forbes data, shows the largest company headquartered in each state (based on worldwide
Read MoreTrade as % of U.S. state GDP 1 Michigan – 38.0% ($178 billion) 2 Louisiana – 35.1% ($84 billion) 3
Read More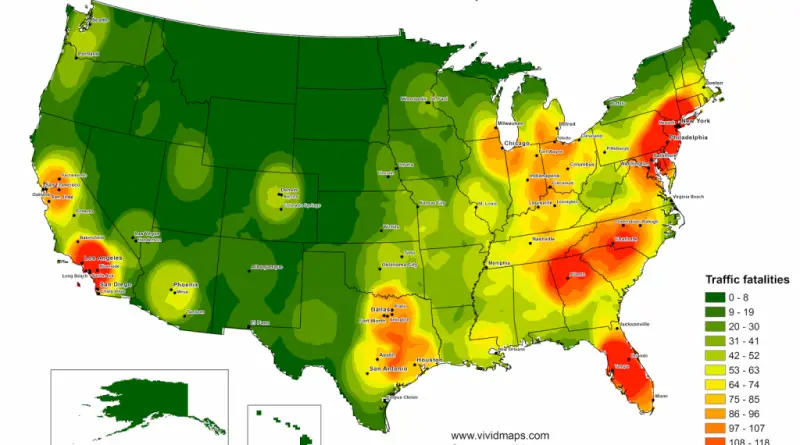
While most crashes don’t happen on highways, some U.S. roads are far more deadly than others. Here’s what makes these highways so dangerous—and where fatal crashes are most common.
Read More
Ella Koeze Counties with the highest mortality rates (2014) 1 Union (Florida) 2 Buffalo (South Dakota) 3 Oglala Lakota (South
Read MoreWhite Collar Crime Risk Zones uses machine learning to predict where financial crimes are mostly likely to occur across the
Read More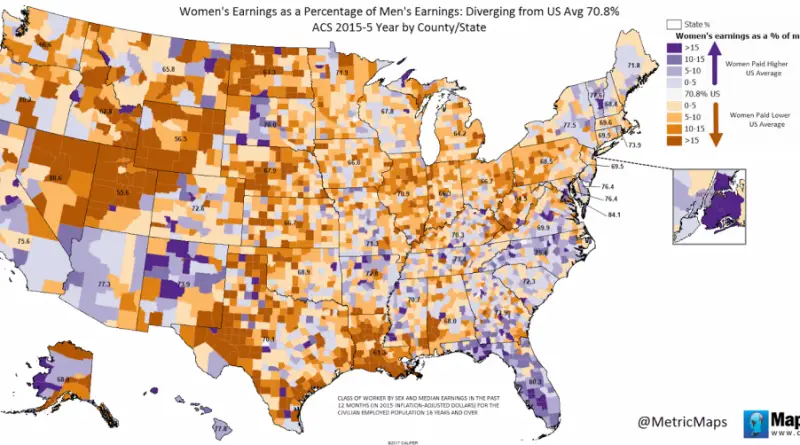
Women’s Earnings as % of Men’s Earning: diverging from U.S. average 70.8% Source: www.metricmaps.org/2017/04/25/womens-earnings-as-of-mens
Read MoreTop 20 the most oldest U.S. companies Caswell-Massey – a perfume and soap company in Newport, Rhode Island (1752) The
Read More
New York City Los Angeles San Francisco Chicago Source: sil.uc.edu
Read MoreThe cheapest power plant to build today in every U.S. county, including availability zones The second minimum cost technology for
Read More
World countries Population Fitted into the United States Population density of the U.S. named for similarly dense countries in Europe
Read More