CulinaryFoodWorld

The Most Photographed Food in the U.S.

This post may contain affiliate links. As an Amazon Associate, we earn from qualifying purchases.

Trover is an application and a website for photo sharing.

Trover made an in-depth analysis of photos using Google’s Vision A.I. technology. This pre-trained machine learning model identifies various things in pictures, including emotions, writing, and different things, including many types of food and drink. The technology is capable of classifying these objects with a vast range of labels, such as ‘fried food,’ ‘Buffalo wings,’ ‘cocktail,’ and ‘mojito.’

For this analysis, all photos were uploaded to Trover from the United States through Google’s Vision A.I. to identify the types of food and drink a shot. It gave a broad listing of labels. Then this list of tags has classed into broad groups, such as ‘Italian food,’ ‘Fast food’ and ‘Alcohol.’ As there were various overall amounts of photos from each U.S. state, then estimated the predominance of each group in each state to generate an aggregate ranking for the group. The U.S. state, where the photos in a group had the most significant percentage of all food photos in the U.S. state, came top of the ranking.

The atlas of the most photographed food in each U.S. state you can see below.
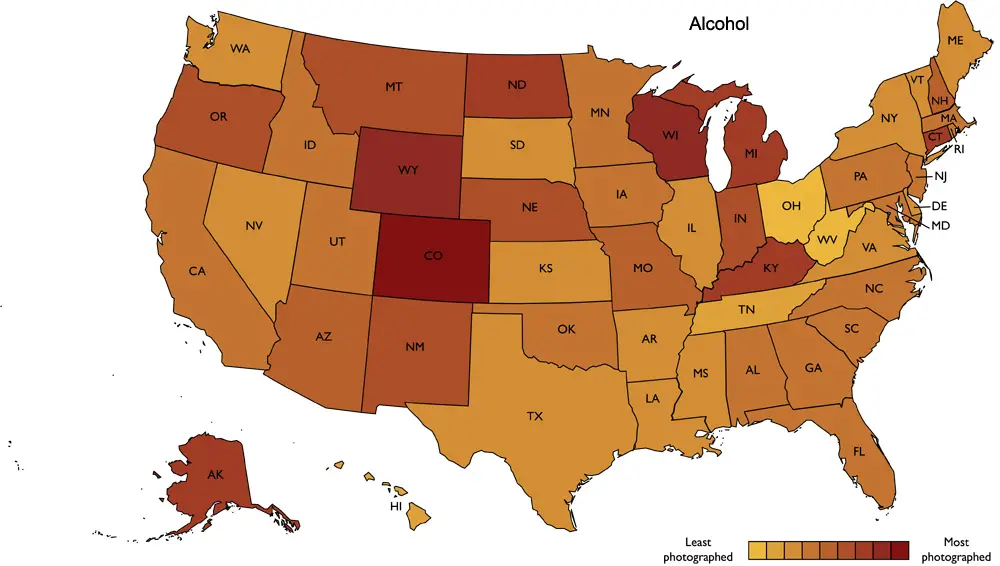
Alcohol

Coloradans are the most enthusiastic drinkers. Approximately 13 percent of all photos uploaded in Colorado were classified as alcohol. California’s brewing scene helped it lead the way with the most photos of beer, followed by Washington. North Dakota was fourth in the country for alcohol photos – precisely in line with official statistics for alcohol consumption per capita.

Alcohol in U.S. states

1.Colorado
2.Wyoming
3.Wisconsin
4.North Dakota
5.Connecticut
6.Kentucky
6.Michigan
8.Alaska
9.New Mexico
10.Montana
11.Oregon
12.Nebraska
13.Indiana
14.Arizona
15.Missouri
16.New Hampshire
17.South Carolina
18.Florida
19.Rhode Island
20.Idaho

21.Massachusetts
22.Minnesota
23.Iowa
24.Maryland
25.Utah
26.New Jersey
27.North Carolina
28.Oklahoma
29.Alabama
30.California
31.Pennsylvania
32.Georgia
33.South Dakota
34.Texas
35.Arkansas
36.Washington
37.Nevada
38.Louisiana
39.Virginia
40.New York

41.Delaware
42.Maine
43.Mississippi
44.Illinois
45.Vermont
46.Kansas
47.Washington D.C.
48.Hawaii
49.Tennessee
50.Ohio
51.West Virginia

Asian

Hawaii, New Jersey, Pennsylvania, Washington, and California all make the top ten. New York, on the other hand, is distinguished by its absence, down in 16th place behind Utah and Alaska.

Asian Food in the U.S.

1.Ohio
2.Mississippi
3.South Dakota
4.Arkansas
5.Virginia
6.Texas
7.Indiana
8.Utah
9.Tennessee
9.West Virginia
11.Georgia
12.Rhode Island
13.South Carolina
14.Nevada
15.Florida
16.Illinois
17.Pennsylvania
18.California
19.Arizona
20.Louisiana

21.Nebraska
22.Michigan
23.Minnesota
24.Washington
25.Idaho
25.Missouri
27.Washington D.C.
28.North Carolina
29.Hawaii
30.Alabama
31.New York
32.Kentucky
33.New Mexico
33.Oregon
35.Maryland
36.Iowa
37.Montana
38.North Dakota
39.Maine 40.Massachusetts

41.New Jersey
42.Delaware
43.Wisconsin
44.Alaska
45.Oklahoma
46.Vermont
47.Colorado
48.Connecticut
49.Wyoming
50.Kansas
51.New Hampshire

Comfort food

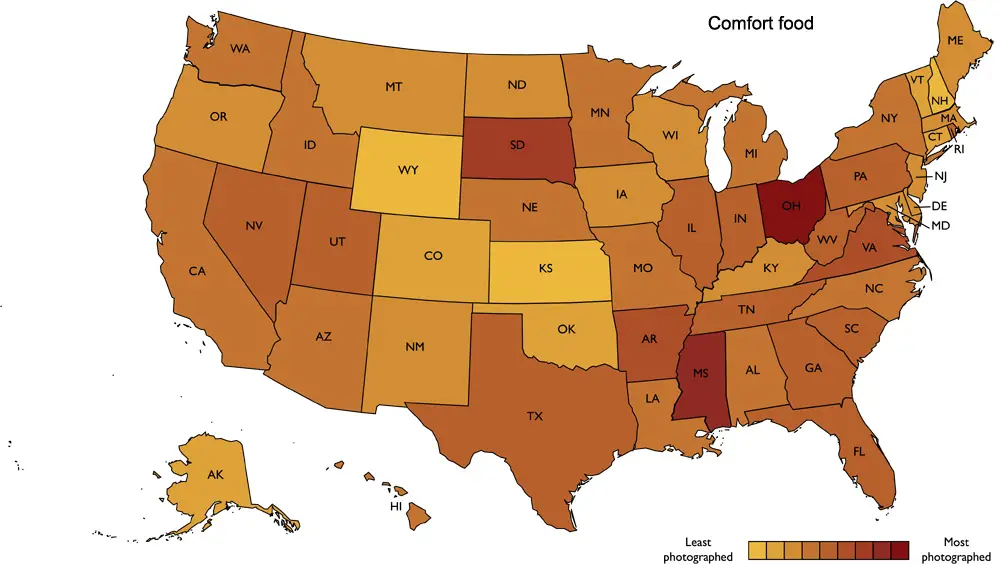
Mac and cheese, fried chicken, pizza. This stuff might not always be good for you, but it sure is good. That’s probably why comfort food was the most photographed category overall. There were 12 U.S. states where comfort food was considered for more than 10 percent of all photographs analyzed, but Ohio topped the bill.

Comfort food in the U.S.

1.Nebraska
2.Minnesota
3.Pennsylvania
4.New Jersey
5.Hawaii
6.Iowa
7.Indiana
8.Washington
9.California
10.Virginia
11.Ohio
12.Nevada
13.Alaska
14.Utah
15.Illinois
16.New York
17.Texas
18.Alabama
19.North Carolina
20.Oregon

21.Massachusetts
22.Minnesota
23.Iowa
24.Maryland
25.Utah
26.New Jersey
27.North Carolina
28.Oklahoma
29.Alabama
30.California
31.Pennsylvania
32.Georgia
33.South Dakota
34.Texas
35.Arkansas
36.Washington
37.Nevada
38.Louisiana
39.Virginia
40.New York

41.Delaware
42.Maine
43.Mississippi
44.Illinois
45.Vermont
46.Kansas
47.Washington D.C.
48.Hawaii
49.Tennessee
50.Ohio
51.West Virginia

Fast food

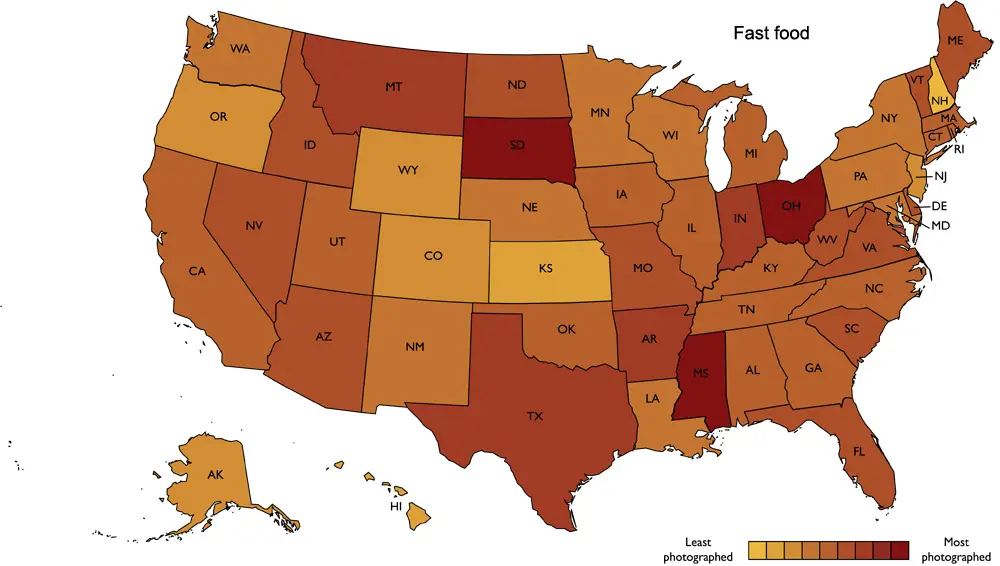
You might not think of hamburgers, French fries, and hot dogs as the most photogenic foods. But then again, there’s a decent chance you’ve snapped them yourself, mainly if you live in Ohio or Mississippi, where fast food accounted for 10 percent of all food photos.

Fast food

1.Ohio
2.Mississippi
3.South Dakota
4.Arkansas
5.Indiana
6.Montana
7.Texas
8.North Dakota
9.Idaho
10.Delaware
10.Florida
12.Nevada
13.Virginia
14.Missouri
15.Vermont
16.Maine
16.West Virginia
18.Arizona
19.South Carolina
20.Tennessee

21.Utah
22.Oklahoma
23.Kentucky
24.Iowa
25.Georgia
26.California
27.Connecticut
27.Illinois
29.Michigan
30.Rhode Island
31.Alabama
32.Massachusetts
33.North Carolina
34.Pennsylvania
35.Nebraska
36.Louisiana
36.New Mexico
38.Minnesota
39.New York
40.Washington

41.Wisconsin
42.Maryland
43.Washington D.C.
44.Colorado
45.Alaska
46.Oregon
47.Wyoming
48.New Jersey
49.Hawaii
50.Kansas
51.New Hampshire

Healthy

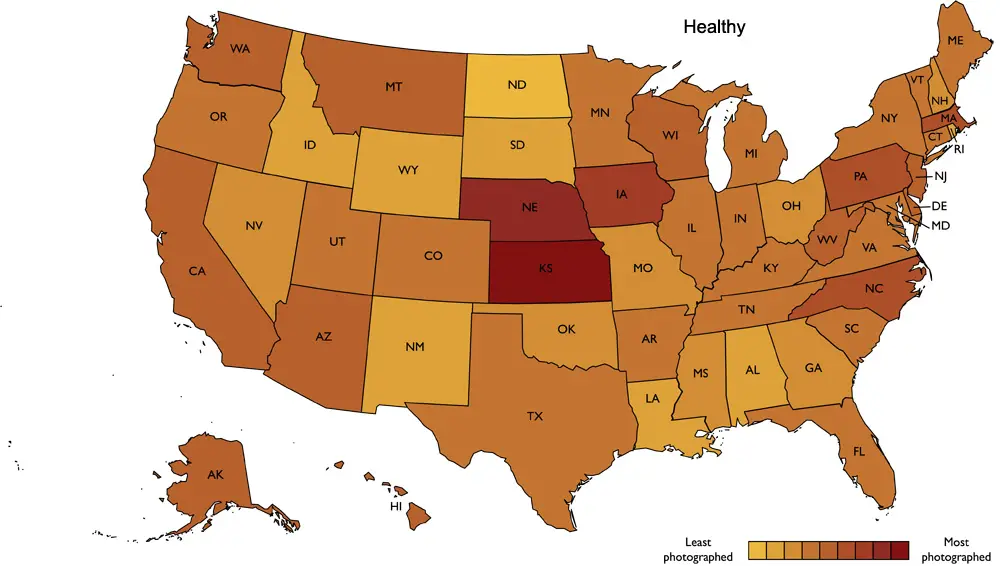
California might be stereotypically health-conscious, but it didn’t even make the top ten for photos of salads, juices, fruit, vegetables, and other healthy foods. Kansas had the highest proportion of healthy food photos, accompanied by neighboring Nebraska.

Healthy food in the Unitied States

1.Kansas
2.Nebraska
3.Iowa
4.Massachusetts
5.Pennsylvania
6.North Carolina
7.West Virginia
7.Wisconsin
9.New Jersey
10.Alaska
11.Hawaii
12.Delaware
13.Arizona
14.Washington
15.California
16.Montana
17.Minnesota
18.Tennessee
19.Vermont
20.Florida

21.Texas
22.Maryland
22.New York
24.Michigan
24. Oregon
26.Colorado
27.Illinois
27.Indiana
27.Maine
30.Kentucky
31.Washington D.C.
32.Connecticut
33.Arkansas
34.Virginia
35.South Carolina
36.Utah
37.Missouri
38.Georgia
39.Nevada
40.New Hampshire

41.Mississippi
42.Oklahoma
43.Ohio
44.Alabama
45.Idaho
46.South Dakota
47.Louisiana
48.New Mexico
49.Rhode Island
50.Wyoming
51.North Dakota

Italian

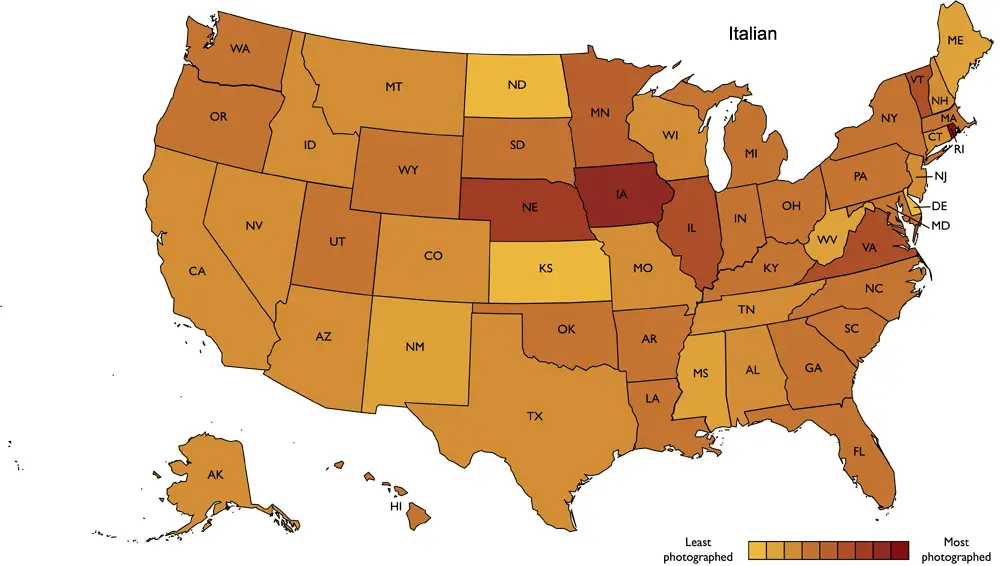
A few U.S.states can stake their claim to be the home of Italian food in the United States. But Rhode Island came out on top, with the highest proportion of photos of Italian food. Rode Island reportedly has the highest percentage of Italian American residents of any state.

Italian food

1.Rhode Island
2.Iowa
3.Vermont
4.Nebraska
5.Illinois
6.Virginia
7.Michigan
8.New York
9.South Dakota
10.Ohio
11.Pennsylvania
12.Oklahoma
13.Massachusetts
14.Florida
15.Kentucky
16.South Carolina
17.Indiana
18.Georgia
18.Utah
20.Louisiana

21.North Carolina
21.Washington
23.Minnesota
23.Oregon
25.Maryland
26.Wyoming
27.Arkansas
28.Hawaii
29.California
30.Montana
30.Nevada
32.Colorado
33.Connecticut
34.New Hampshire
35.Texas
36.Alaska
37.New Jersey
38.Arizona
38.Idaho
40.Missouri

41.Tennessee
42.Alabama
43.Wisconsin
44.Washington D.C.
45.Maine
46.New Mexico
47.West Virginia
48.Mississippi
49.Kansas
50.Delaware
51.North Dakota

Latin American

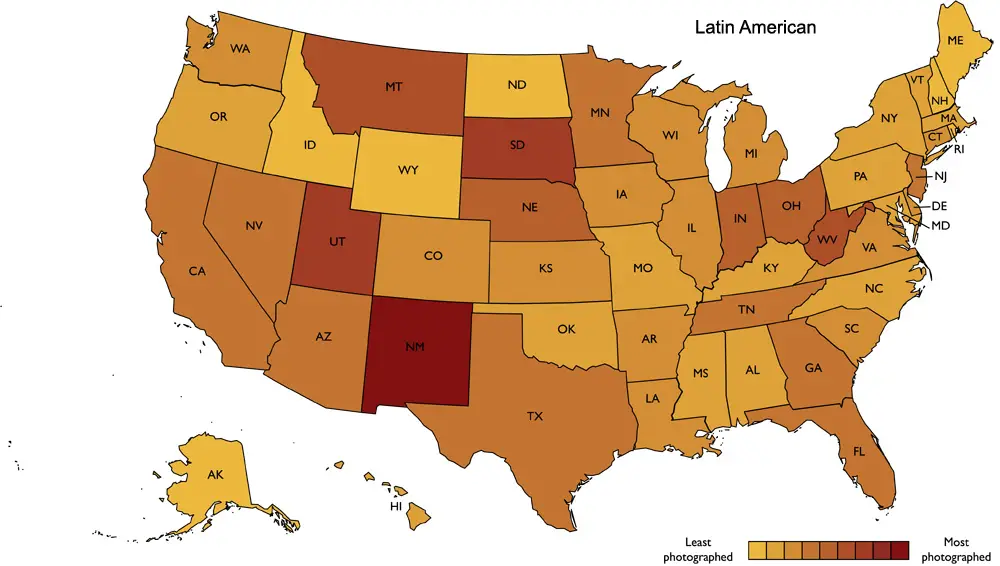
No prizes for guessing the U.S. state that topped this category, which includes Mexican food. New Mexico was number one, with Texas also making the top ten. In between, however, were a few surprises. Utah came out of leftfield to take second place, and Montana also made the top five.

Latin American Food in the U.S.

1.New Mexico
2.Utah
3.South Dakota
4.Montana
5.West Virginia
6.Nebraska
7.Indiana
8.Ohio
9.Minnesota
10.Texas
11.Arizona
12.New Jersey
13.Tennessee
14.California
15.Florida
16.Georgia
16.Nevada
18.South Carolina
19.Connecticut
20.Louisiana

20.Washington
22.Arkansas
23.Illinois
24.Virginia
25.Colorado
25.Delaware
25.Wisconsin
28.Michigan
29.Iowa
29.Kansas
31.Kentucky
32.Missouri
33.New York
34.Oregon
35.Mississippi
36.Alabama
36.Vermont
38.Hawaii
39.Maryland
40.Pennsylvania

41.Washington D.C.
42.North Carolina
43.Oklahoma
44.Massachusetts
45.Alaska
46.New Hampshire
47.Idaho
47.Maine
47.North Dakota
47.Rhode Island
47.Wyoming

Seafood

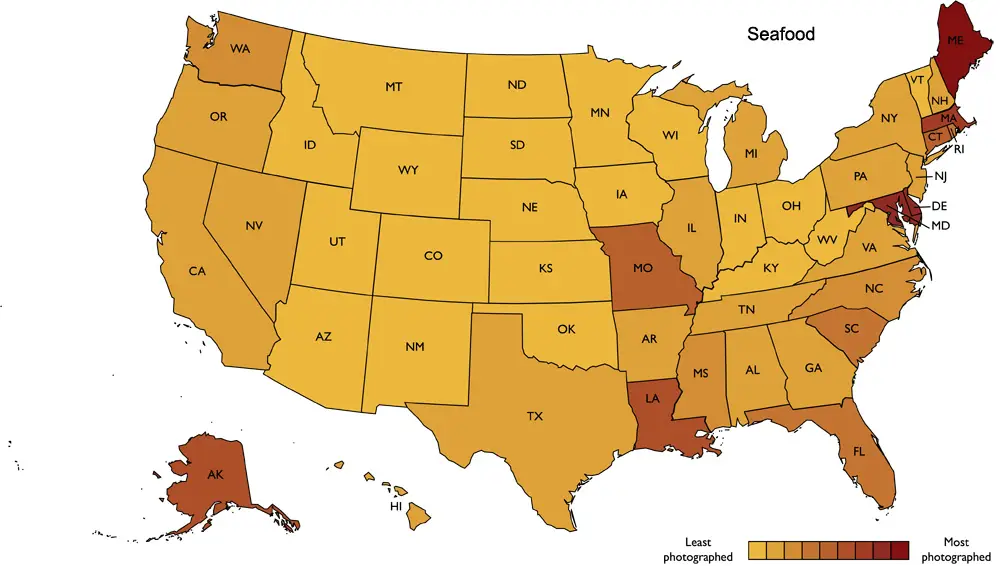
The Eastern Seaboard rules when it comes to photos of fish and seafood. Maine, Delaware, Maryland, and Massachusetts topped the ranking, with Louisiana in fifth. It makes sense – the home of shrimp gumbo, oyster po’ boys, the crawfish boil, and blackened catfish was always going to feature. Meanwhile, landlocked North Dakota, Montana, and Nebraska are dropping out at the bottom of the ranking.

1.Maine
2.Delaware
3.Maryland
4.Massachusetts
5.Louisiana
6.Alaska
7.Connecticut
8.Missouri
9.Florida
10.Rhode Island
11.South Carolina
12.Mississippi
13.Washington
14.North Carolina
15.New Jersey
16.Virginia
17.Hawaii
18.Alabama
19.Washington D.C.
20.Georgia

21.California
22.Texas
23.New Hampshire
24.Nevada
25.Illinois
25.New York
27.Iowa
27.Pennsylvania
28.Arkansas
29.Tennessee
30.Michigan
31.Oregon
32.Kentucky
33.Utah
34.Minnesota
35.Arizona
36.Colorado
37.Ohio
39.Vermont
40.Wyoming

41.New Mexico
42.Wisconsin
43.Oklahoma
44.Idaho
45.Kansas
46.Indiana
46.Montana
46.Nebraska
46.North Dakota
46.South Dakota
46.West Virginia

Sweets

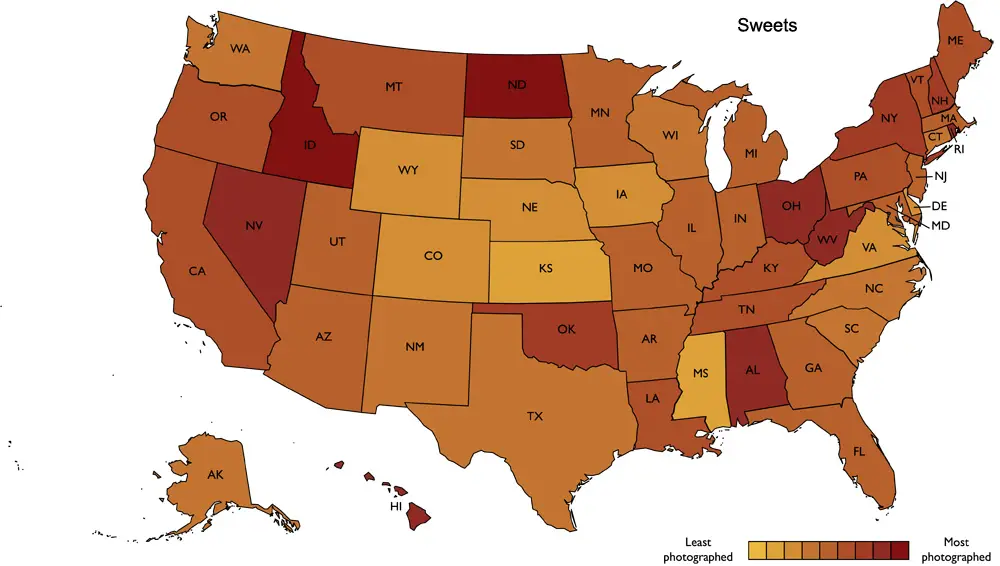
The tech identified a vast range of candy, desserts, and more from apple pie to zuccotto. On average sweet foods estimated for 6 percent of food photos analyzed in any given U.S. state, and an average of 10 percent for the top five states: North Dakota, Idaho, Alabama, Rhode Island, and Ohio.

Sweets in the U.S.

1.North Dakota
2.Idaho
3.Alabama
4.Rhode Island
5.Ohio
6.Nevada
7.Hawaii
8.West Virginia
9.Washington D.C.
10.New Hampshire
11.New York
12.Oklahoma
13.Vermont
14.Oregon
15.Montana
16.Louisiana
17.Kentucky
18.Maine
19.Tennessee
20.Pennsylvania

21.California
22.Utah
23.Georgia
24.Indiana
25.Illinois
26.Missouri
27.New Jersey
28.Minnesota
29.Arizona
30.Massachusetts
31.Arkansas
32.Florida
33.Michigan
34.Washington
35.Connecticut
36.Maryland
37.South Carolina
38.Alaska
39.South Dakota
40.Texas

41.Wisconsin
42.North Carolina
43.New Mexico
44.Colorado
45.Wyoming
46.Virginia
47.Iowa
48.Delaware
49.Nebraska
50.Kansas
51.Mississippi

Vegetarian

Photos of vegetarian food are most prevalent in Iowa, where almost 8 percent of all images were classified as ‘vegetarian.’ It may come as a surprise that BBQ-loving Kansas came a close second. More predictably, Maine, which has among the most all-vegan restaurants per capita in the United States, was fourth.

Vegeterian food in the US

1. Iowa
2. Kansas
3. Nebraska
4. Maine
5. Massachusetts
6. West Virginia
7. Wisconsin
8. Alaska
9. Hawaii
10. Connecticut
11. Idaho
12. Pennsylvania
13. North Carolina
14. Washington D.C.
15. New Jersey
16. California
17. Arizona
18. Montana
19. New York
20. Tennessee

21. Virginia
22. Illinois
23. Washington
24. Minnesota
25. Florida
26. New Hampshire
26. Vermont
28. Michigan
29. Texas
30. Delaware
31. Georgia
32. Maryland
32. Missouri
34. Ohio
35. Kentucky
36. Nevada
37. Oregon
38. Colorado
39. Indiana
40. Arkansas

41. South Carolina
42. Alabama
43. Utah
44. New Mexico
45. Mississippi
46. Oklahoma
47. Louisiana
48. Rhode Island
49. North Dakota
50. South Dakota
51. Wyoming

0 0 votes
Article Rating
Subscribe
Notify of
guest

0 Comments
Oldest
Newest Most Voted
Inline Feedbacks
View all comments
0
Would love your thoughts, please comment.x
()
x