Exploring Europe’s Urban Landscape
Europe’s urban landscape continually evolves, with cities expanding and populations shifting. As of 2023, approximately 75.7% of the European Union’s population resides in urban areas, reflecting a steady increase in urbanization over recent decades. Trading Economics
Visualizing these trends can be both insightful and engaging. One compelling method is through joy-plot maps, also known as ridgeline plots. These visualizations depict data distributions across different categories, creating overlapping line plots resembling mountain ridges. An exemplary application of this technique is the interactive joy-plot map of European population density developed using Gridviz, a JavaScript library designed for visualizing gridded data. This map utilizes the Eurostat GISCO Population distribution dataset to represent population density as horizontal ridgelines, where vertical peaks indicate areas of higher population concentration. As users zoom in, the map reveals finer details, offering a multi-resolution exploration of Europe’s demographic patterns.
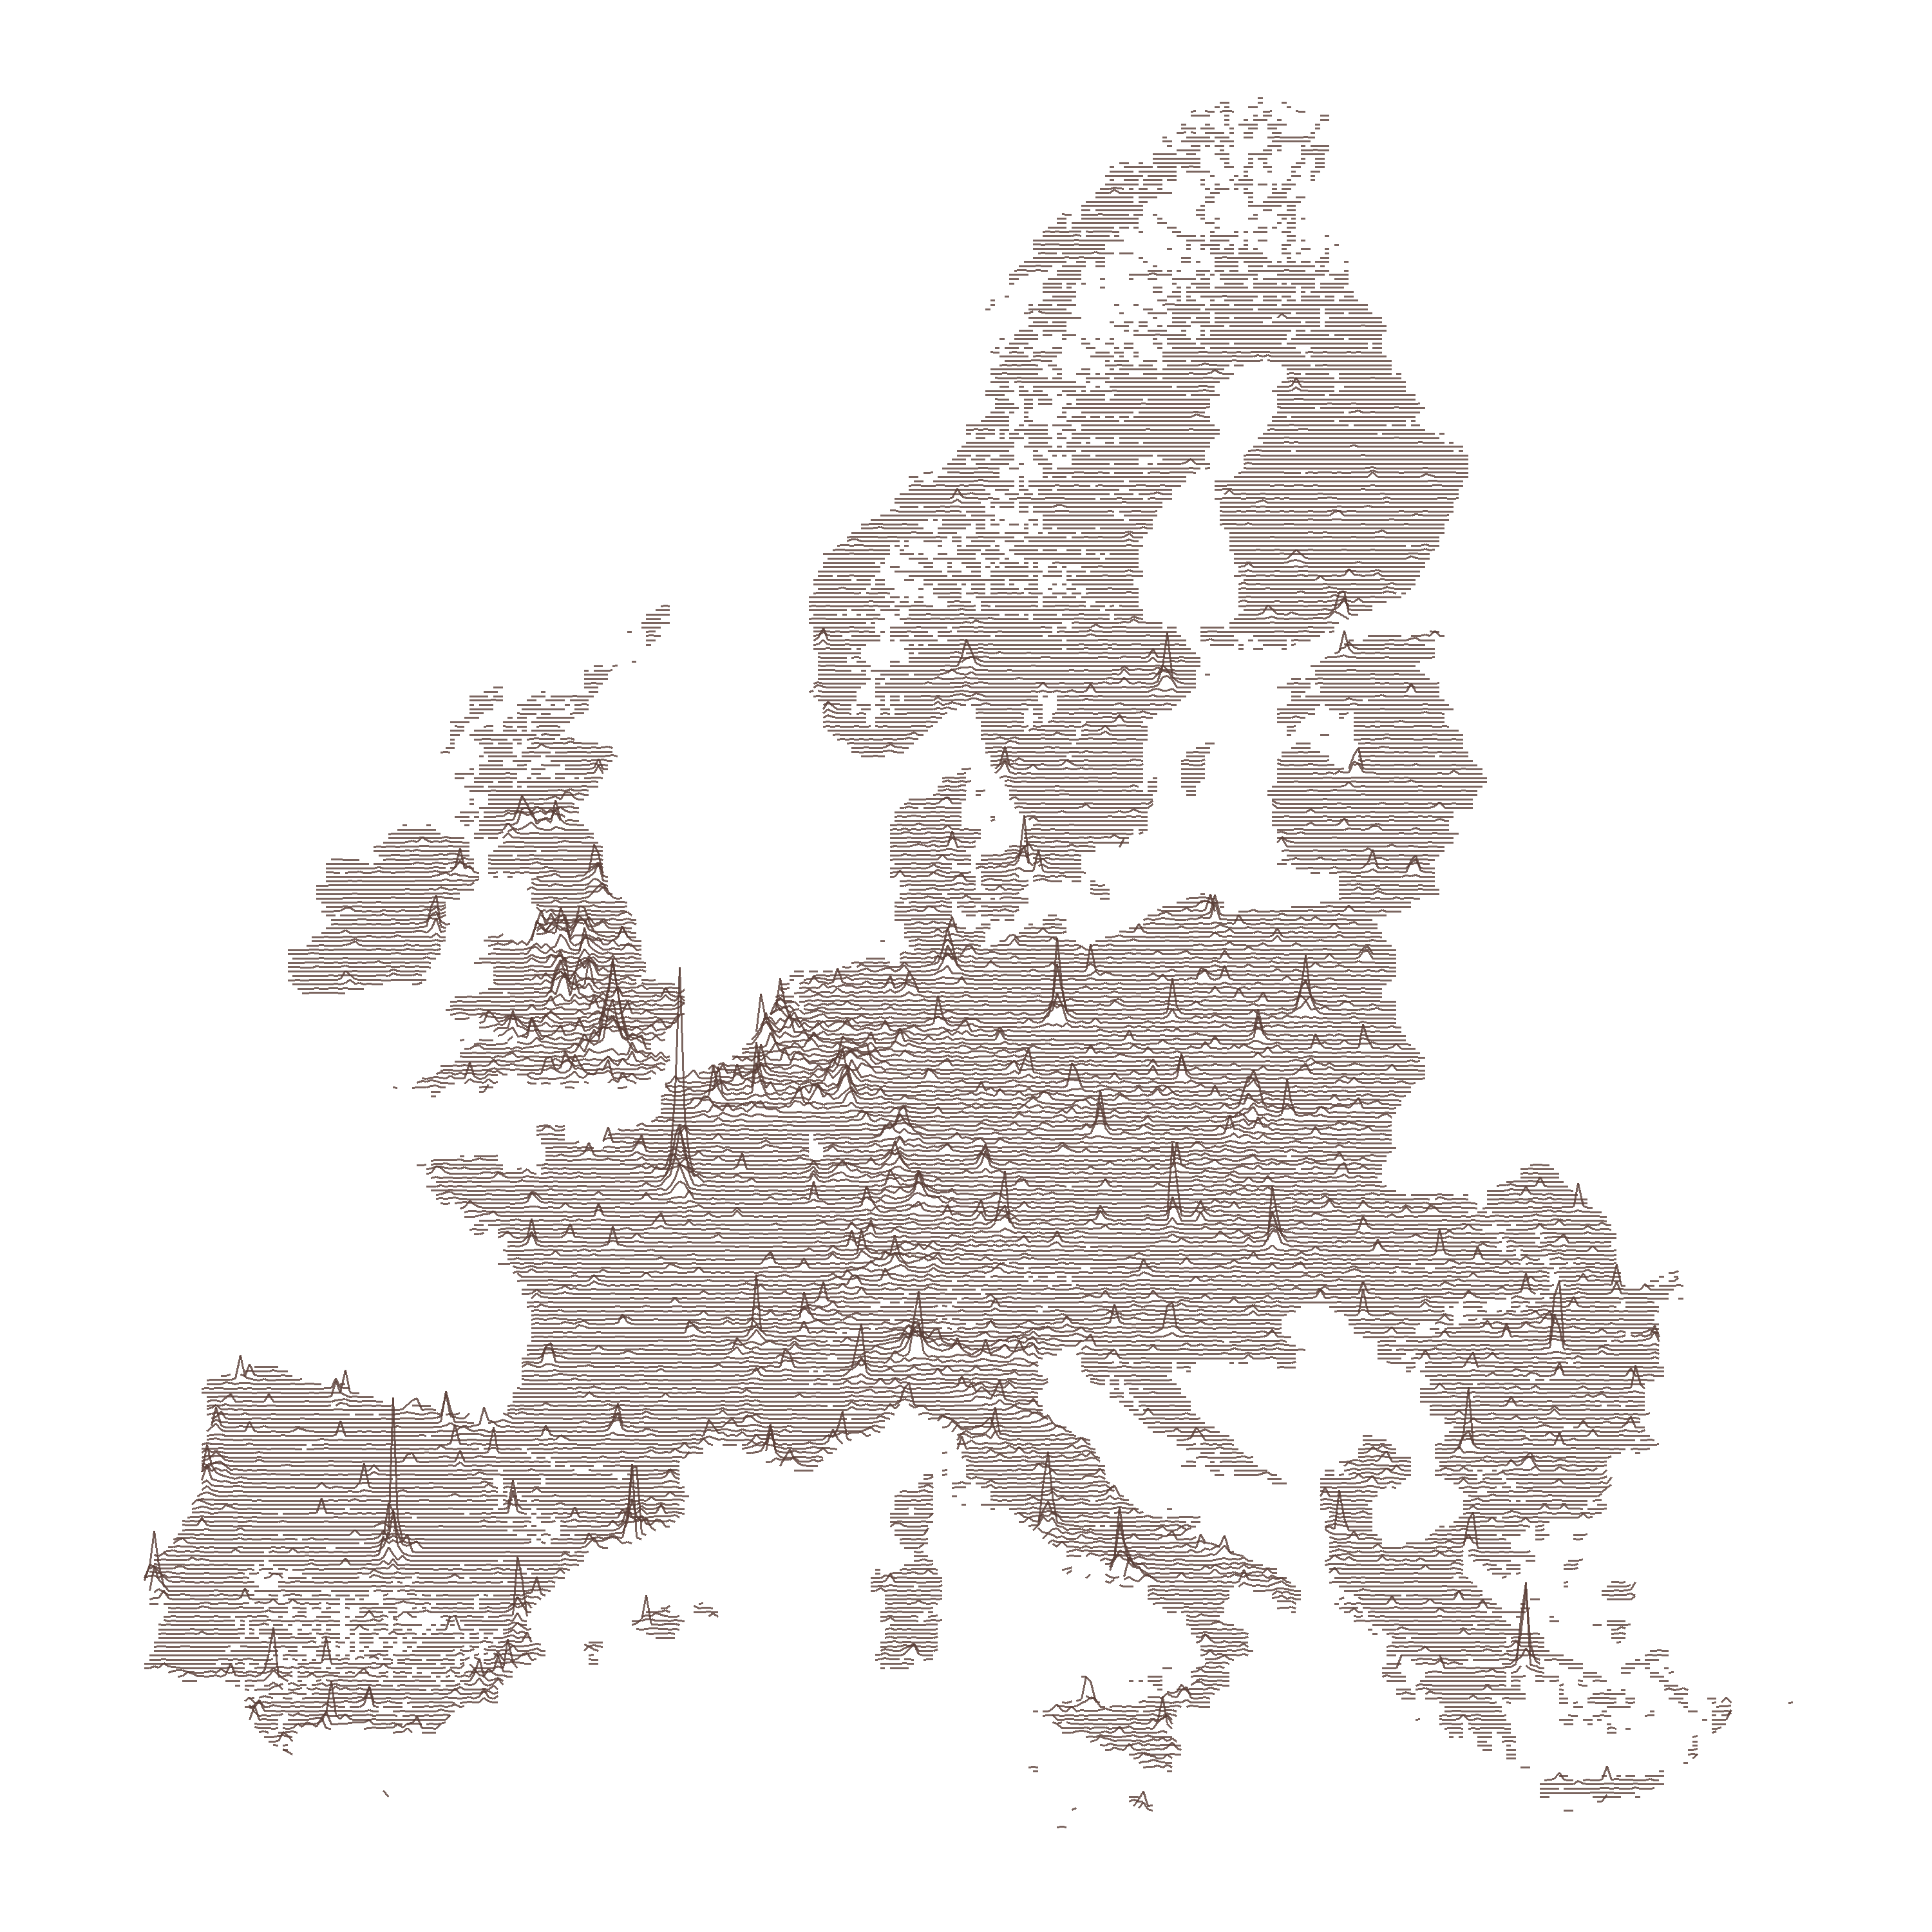
Here is the interactive version of the Joy-Plot Map of European Population Density.
Understanding the distribution of Europe’s urban population also involves examining its largest metropolitan regions. According to Eurostat data from 2023, the most populous metropolitan areas in the EU are:
- Paris, France: 12.4 million inhabitants
- Madrid, Spain: 6.9 million inhabitants
- Barcelona, Spain: 5.8 million inhabitants
- Berlin, Germany: 5.5 million inhabitants
- Ruhrgebiet, Germany: 5.1 million inhabitants
It’s important to note that these numbers reflect populations within metropolitan areas and may differ from broader administrative area figures.


