When you think of the United States, what comes to mind? Chances are, it’s not just one image, but many – and for good reason. The U.S. is home to an incredible variety of landscapes and climates, from scorching deserts to frigid tundras, and everything in between. This diversity is part of what makes America such a fascinating country to explore, whether you’re planning a road trip or just curious about how weather patterns vary across the nation.
Let’s take a closer look at these climate differences using some detailed United States maps. These visual guides will help us understand just how much temperatures can change from one part of the country to another.
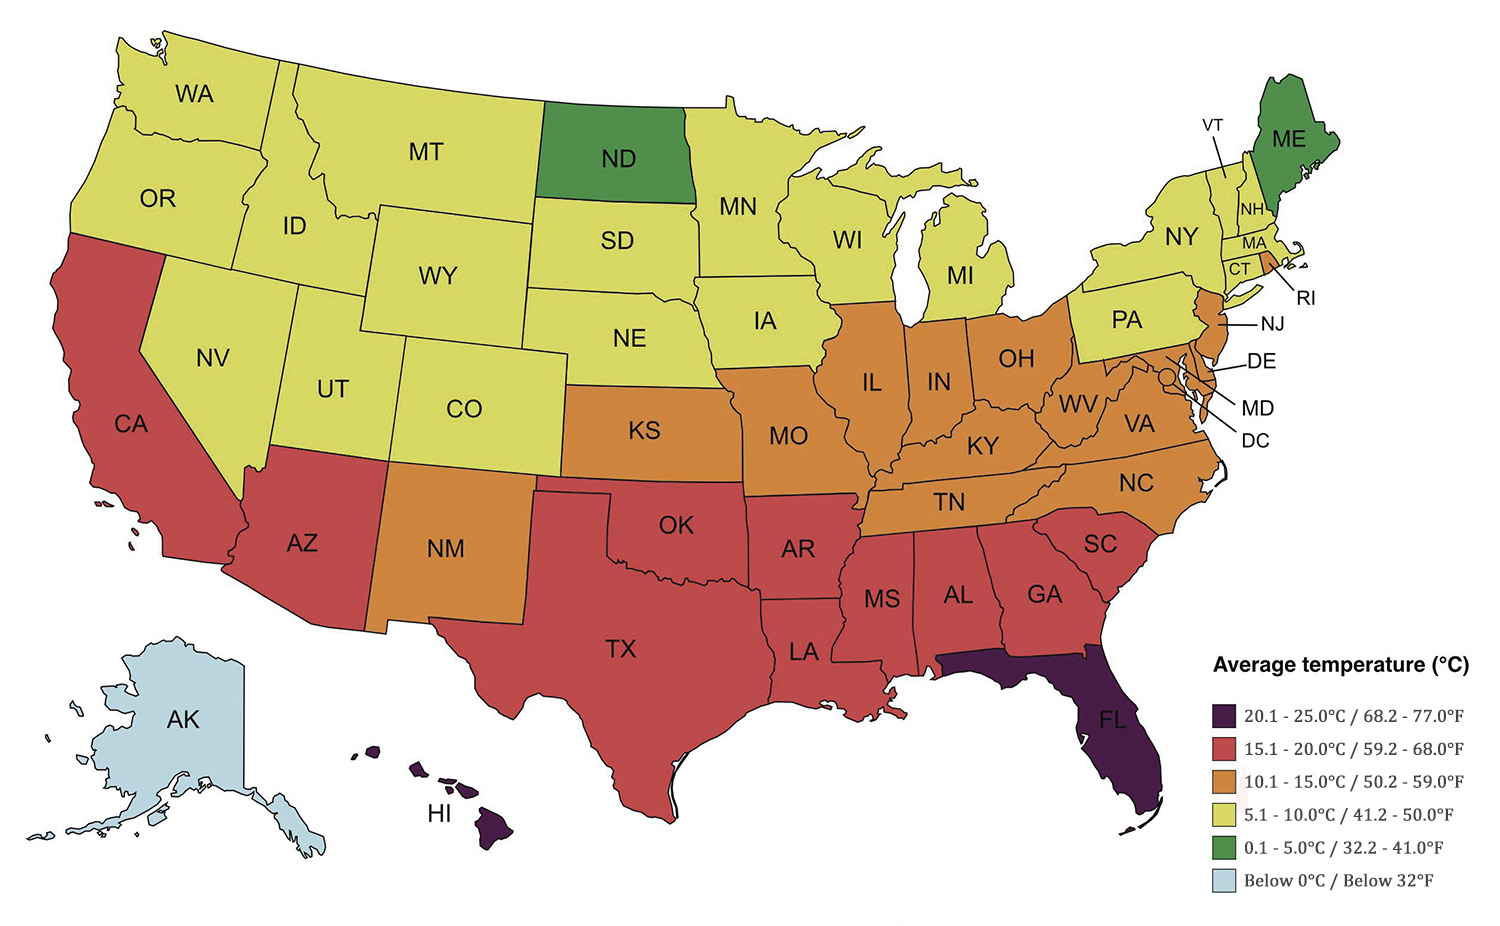
This colorful map gives us a bird’s-eye view of average temperatures across the U.S. states. Right away, you can spot the warmest areas – Florida and Hawaii stand out, with average temperatures between 20.1°C and 25.0°C (68.2°F to 77.0°F). It’s no wonder these states are popular vacation spots year-round!
On the flip side, Alaska takes the prize for the coldest state, with average temperatures dipping below 0°C (32°F). This chilly climate is responsible for Alaska’s stunning winter scenery and natural wonders like the Northern Lights.
Just behind Alaska in the cold rankings are North Dakota and Maine. These states see average temperatures between 0.1°C and 5.0°C (32.2°F to 41.0°F), leading to long, cold winters that shape both the landscape and the lifestyle of the people who call these places home.
But there’s more to the story than just these extremes. To get a more detailed picture, let’s look at a map that breaks down temperatures by county.
This county-level map reveals just how complex U.S. climate patterns really are. Within the lower 48 states alone, you’ll find average annual temperatures ranging from a toasty 75°F (23.9°C) in parts of Florida to a chilly 20°F (-6.7°C) in some northern areas. When you factor in Alaska, that range gets even wider.
Here’s an interesting fact: if you average out temperatures across the entire U.S. (not counting Hawaii and Alaska), you get a moderate 52.7°F (11.5°C). But as our maps show, that number doesn’t come close to telling the whole story.
So what’s behind all these temperature differences? A big part of it comes down to geography. The western half of the country, with its mountains and plateaus, tends to be drier than the east. But there are always exceptions – like the rainy Pacific Northwest coast.
In the central and eastern U.S., the land flattens out, leading to more humid and rainy weather. This area is also known for its unpredictable conditions, as it’s often caught between competing air masses. Cold, dry air from Canada clashes with warm, moist air from the Gulf of Mexico, sometimes resulting in severe weather like storms, tornadoes, and blizzards.
The Great Plains, stretching through the middle of the country, see some of the most extreme temperature swings. Winters can be brutally cold, while summers bring intense heat waves. However, this region tends to be less humid and gets less rain than the East Coast, especially in winter.
One of the most interesting things about U.S. weather is how quickly it can change. Because there aren’t many barriers to stop air movement from Canada, almost the whole country can experience sudden cold snaps in winter. How long and intense these cold spells are depends on where you are. In the South, temperatures might dip below freezing for just a couple of days. But in northern and inland areas, as well as mountains, cold periods can last much longer and be much more severe.
Understanding these climate patterns isn’t just about satisfying curiosity. It’s crucial for agriculture, city planning, energy use, and even personal choices like where to live or vacation. That’s why having a good United States map can be so valuable, whether you’re a student, a traveler, or just someone interested in how geography affects weather.
If you want to explore further, there are lots of high-quality United States maps available that can help you visualize these climate patterns and more. Here are a few worth checking out:

?")


How is New Mexico so cold?
The rocky mountain range