As of the most recent data from 2022, there are approximately 62.1 million Hispanic Americans in the United States, making up about 18.9% of the total U.S. population. This includes individuals of Mexican, Puerto Rican, Cuban, Salvadoran, Dominican, and other Hispanic or Latino origins. The Hispanic population has been steadily increasing over the years, reflecting both natural growth and immigration.
Spatial Patterns in the Distribution of Hispanic Americans
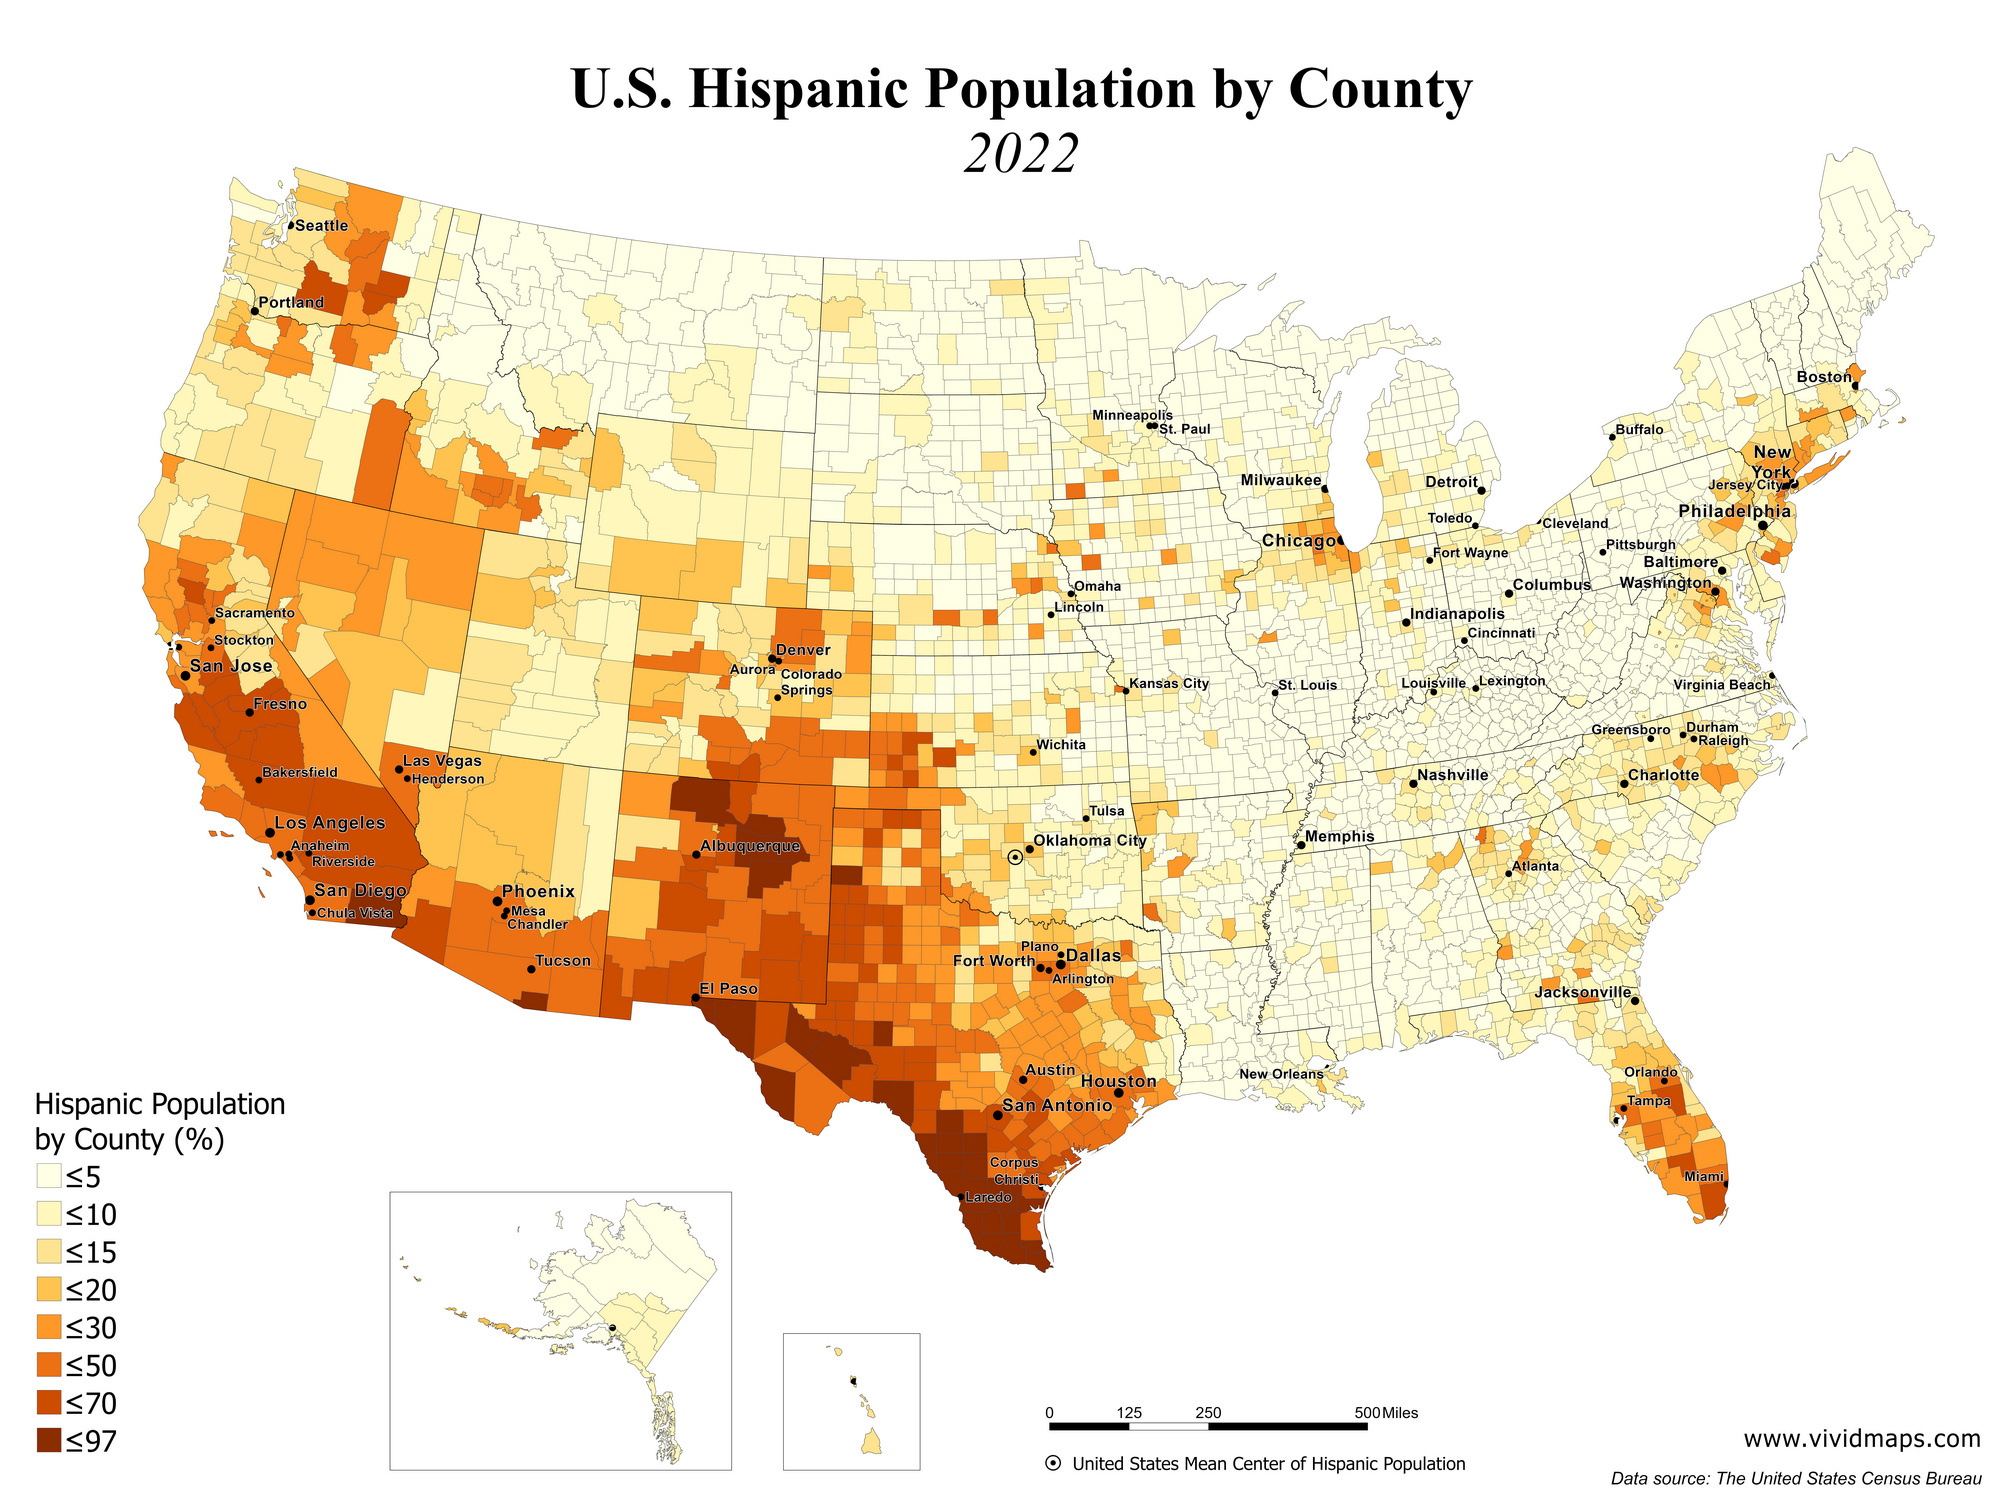
Hispanic Americans are spread throughout the United States, but their distribution is characterized by certain regional patterns. Historically, a significant proportion of Hispanic Americans have resided in the Southwestern states, such as California, Texas, Arizona, and New Mexico. However, recent decades have seen a substantial migration to other parts of the country, including the South, Midwest, and Northeast.
Here is the map of the United States showing the Hispanic population, created by me using U.S. Census data.
States with the Highest Percentage of Hispanic Americans:
State
Percentage
New Mexico
49.3%
California
39.4%
Texas
39.3%
Arizona
31.7%
Nevada
29.2%
States with the Lowest Percentage of Hispanic Americans:
State
Percentage
West Virginia
1.6%
Maine
1.8%
Vermont
2.0%
North Dakota
3.4%
South Dakota
3.7%
Counties with the Highest Percentage of Hispanic Americans:
County
Percentage
Starr County, Texas
96.2%
Webb County, Texas
95.7%
Maverick County, Texas
95.3%
Zavala County, Texas
94.7%
Jim Hogg County, Texas
94.5%
Counties with the Lowest Percentage of Hispanic Americans:
County
Percentage
McDowell County, WV
0.3%
Tucker County, WV
0.3%
Teton County, WY
0.4%
Hampshire County, WV
0.4%
Mineral County, WV
0.4%
Changes Over Time: Animated Map of Hispanic Population by County (1990-2022)
The distribution and percentage of Hispanic Americans have evolved significantly over the decades. To illustrate these changes, I have created an animated map showing the U.S. Hispanic Population by County from 1990 to 2022. This visualization highlights several trends:
1990s: The Hispanic population was heavily concentrated in the Southwestern states and major urban areas.
2000s: There was noticeable migration to Southern and Midwestern states, reflecting broader economic opportunities.
2010s: Continued growth in metropolitan areas, with increased dispersion to states in the Northeast and Northwest.
2020s: The latest data show a persistent trend of urbanization and suburban spread, with significant populations in diverse regions across the country.
Additional Interesting Facts About Hispanic Americans
Cultural Contributions: Hispanic Americans have enriched the cultural fabric of the U.S. through music, cuisine, literature, and the arts. Celebrations like Cinco de Mayo and Hispanic Heritage Month highlight their cultural impact.
Economic Impact: Hispanic Americans play a crucial role in the U.S. economy, with a significant number of entrepreneurs and business owners contributing to economic growth.
Educational Achievements: There has been a steady increase in educational attainment among Hispanic Americans, with more individuals earning high school diplomas and college degrees.
Political Influence: Hispanic Americans have become an important voting bloc in U.S. politics, with growing representation at local, state, and federal levels.
Conclusion
Hispanic Americans are a diverse and dynamic community that significantly shapes the United States. Understanding their distribution, growth, and contributions provides valuable insights into the nation’s demographic landscape. The animated map of the U.S. Hispanic Population by County from 1990 to 2022 offers a visual representation of these changes, highlighting the evolving nature of this community over time.
By exploring these aspects, we gain a deeper appreciation of the resilience, progress, and cultural richness of Hispanic Americans, underscoring their pivotal role in shaping the history and future of the United States.
Curious about Hispanic Americans? These books will captivate your interest.
Brazilians aren’t Hispanic, they speak Portuguese. Why aren’t Italians and French called Latins, or Romanians for that matter and what about Haitians, they speak a Latin language and are from Hispaniola?
Alex E
7 years ago
There are more I’m sure. People from Caribbean Latin countries like the Dominican Republic, Puerto Rico and Cuba, tend to stay on the east coast. The fact that New York, New Jersey, and Boston aren’t as colorful as Florida is probably due to people not participating in a census…
Not necessarily, while there may be a comparable number of Hispanics in New York, New Jersey, and Boston, those cities and their surrounding counties are significantly more dense than the much larger counties that make up Florida and Texas. This map is based on the percentage, not total population.


")


Brazilians aren’t Hispanic, they speak Portuguese. Why aren’t Italians and French called Latins, or Romanians for that matter and what about Haitians, they speak a Latin language and are from Hispaniola?
There are more I’m sure. People from Caribbean Latin countries like the Dominican Republic, Puerto Rico and Cuba, tend to stay on the east coast. The fact that New York, New Jersey, and Boston aren’t as colorful as Florida is probably due to people not participating in a census…
Not necessarily, while there may be a comparable number of Hispanics in New York, New Jersey, and Boston, those cities and their surrounding counties are significantly more dense than the much larger counties that make up Florida and Texas. This map is based on the percentage, not total population.