Absence of Hispanic
Hispanic are Americans who are the posterity of immigrants from Spain or Latin America. After Indigenous Americans, Hispanics are the earliest ethnic group to reside much of what is now the U.S.
Hispanics generally are the leading minority ethnic group in the U.S., after non-Hispanic white Americans.
According to U.S. Census Bureau data, in 2020, Hispanics made up 18.7% (62.1 million) of the U.S. population.
Table of Contents
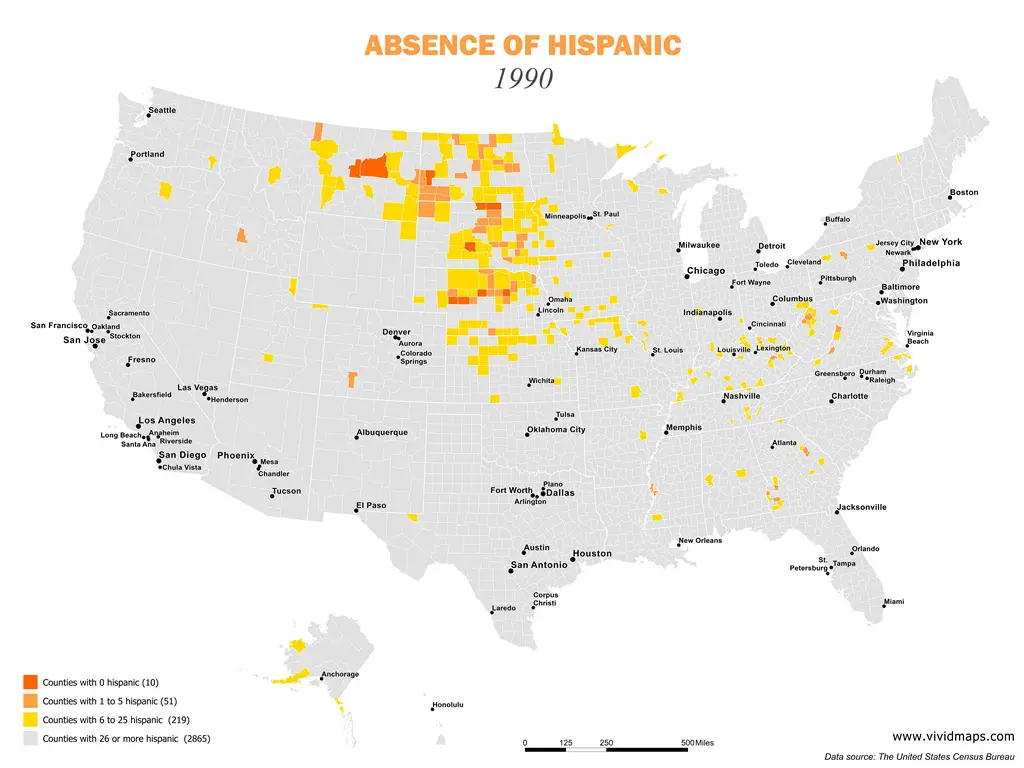
The map below shows the counties with fewer than 0, 5, and 25 Hispanic American residents.
Absence of Hispanic
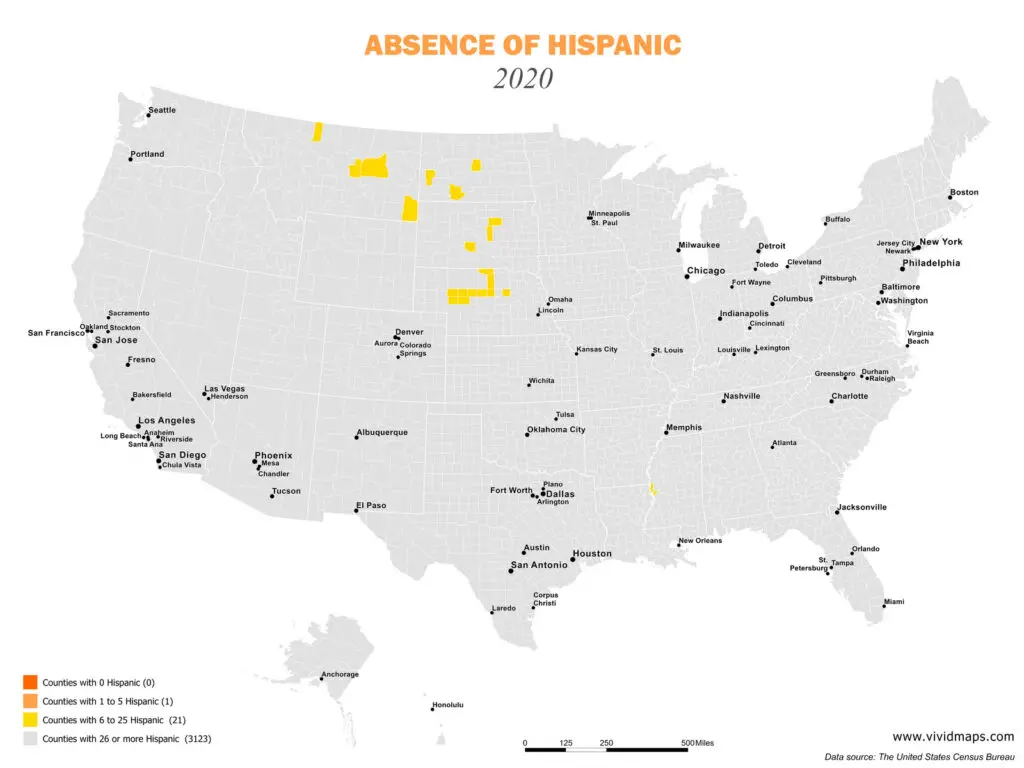
Los Angeles metropolitan area has more Hispanics than any other U.S. county, with almost 5 million in 2020.
Top 20 U.S. counties with the Highest Number of Hispanics (2020)
- Los Angeles (California): 4,881,970
- Harris (Texas): 2,061,019
- Miami-Dade (Florida): 1,886,364
- Maricopa (Arizona): 1,408,855
- Cook (Illinois): 1,319,282
- Riverside (California): 1,236,032
- Bexar (Texas): 1,215,788
- San Bernardino (California): 1,186,808
- San Diego (California): 1,140,033
- Orange (California): 1,081,091
- Dallas (Texas): 1,074,195
- Hidalgo (Texas): 803,455
- Bronx (New York): 799,580
- Klark (Nevada): 717,278
- El Paso (Texas) 696,115
- Queens (New York): 634,934
- Tarrant (Texas): 619,710
- Broward (Florida): 606,982
- Fresno (California): 537,180
- Kern (California): 491,545
Top 20 US counties with Highest Percentage of Hispanics (2020)
- Starr (Texas): 96.33
- Webb (Texas): 95.44
- Maverick (Texas): 95.09
- Zapata (Texas): 94.98
- Zavala (Texas): 93.76
- Jim Hogg (Texas): 92.71
- Hidalgo (Texas): 92.52
- Brooks (Texas): 91.08
- Cameron (Texas): 90.09
- Duval (Taxas): 89.25
- Willacy (Texas): 88.43
- Dimmit (Texas): 87.96
- La Salle (Texas): 86.84
- Imperial (California): 85.41
- Presidio (Texas): 83.53
- Santa Cruz (Arizona): 82.81
- El Paso (Texas): 82.76
- Val Verde (Texas): 82.43
- Mora (New Mexico): 80.79
- Frio (Texas): 80.26
Below is the animated map showing how the absence of Hispanics changed from 1990 to 2020.
Absence of Hispanic (1990 – 2020)
Hispanic Americans are the 2nd rapidly growing ethnic group by percentage growth in the U.S. after Americans of Asian ancestry.
This is partly why Hispanic Americans are amongst the youngest ethnic group in the United States but have had one of the most significant raises in median age over the past decade.
Hispanics made up 51% of total U.S. population growth from 2010 to 2020 and reached 62,1 million in 2020.
From 2005 to 2010, the U.S. Hispanic population rose by an average of 3.4 percent every year, but this growth has decreased to 2 percent a year after then.
The South had the quickest Hispanic Americans population increase of any United States region.
Texas (+2 mln), California (+1.6 mln), and Florida (+1.5 mln) have seen the most significant increases in Hispanic population since 2010, while North Dakota (+148%) and South Dakota (75%) have seen the fastest increases in Hispanic population since 2010. Hispanics have become the most significant racial group in California.
According to the map below, the U.S. counties with the quickest Hispanic population increase tend to have comparatively small Hispanic populations.
Percent change of Hispanic population by U.S. county from 1990 to 2020
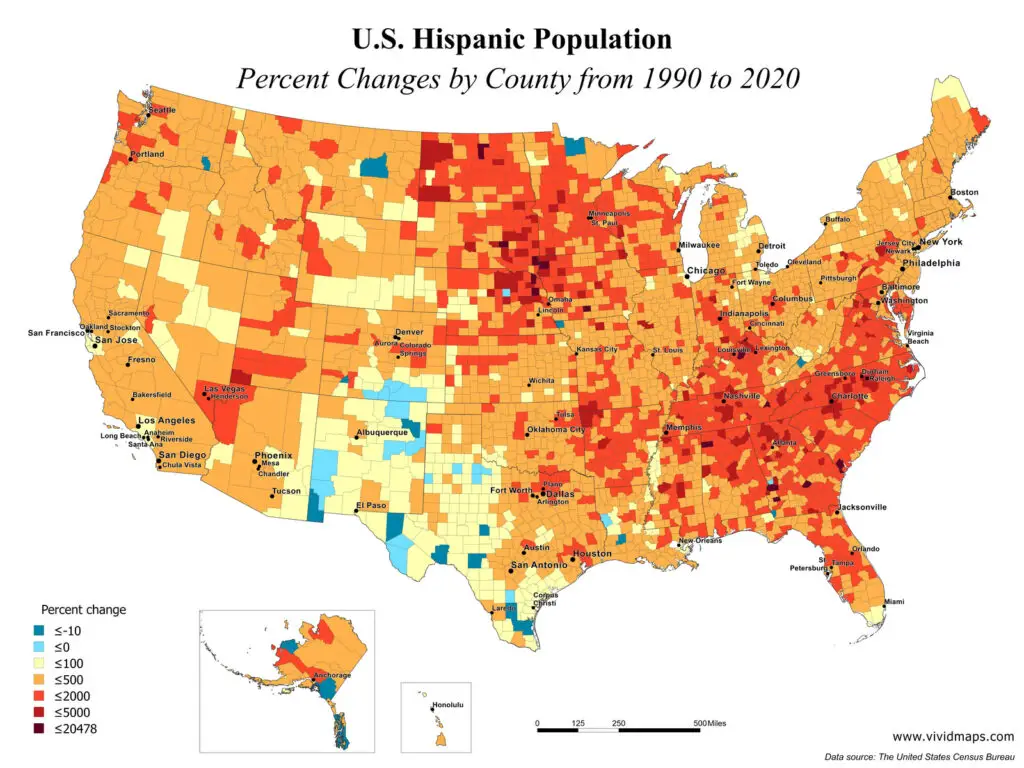
Top 10 US counties with the most significant percentage decrease in the Hispanic population
- Kalawao (Hawaii): -93
- Terrel (Texas): -50
- Seminole (Georgia): -46
- Culberson (Texas): -35
- Harding (New Mexico): -35
- Columbia (Washington): -30
- Buchanan (Virginia): -29
- Atchison (Missouri): -28
- Kenedy (Texas): -23
- San Juan (Colorado): -21
Top 10 US counties with the most significant percentage increase in the Hispanic population
- Dixon (Nebraska): +20,478
- Webster (Georgia): +12,840
- Jerauld (South Dakota): +9,169
- Spencer (Kentucky): +8,991
- Stewart (Georgia): +8,483
- Pierce (North Dakota): +7,805
- Clarke (Iowa): +7,492
- Lincoln (South Dakota): +6,816
- Jasper (South Dakota): +6,002
- Loudon (Tennessee): +5,960

It is projected that the Hispanic population will reach 119 million in 2060 (28.6% of the U.S. population).
Related posts:
– Absence of Black
– Absence of Asian


