The racial and ethnic landscape of the United States has been in flux for centuries. While white Americans remain the majority in most counties, their share of the population has steadily declined, giving rise to counties where racial and ethnic minorities collectively form the majority. The maps in this post illustrate these shifts, offering a deeper understanding of the spatial distribution of different racial and ethnic groups.
The Majority Landscape
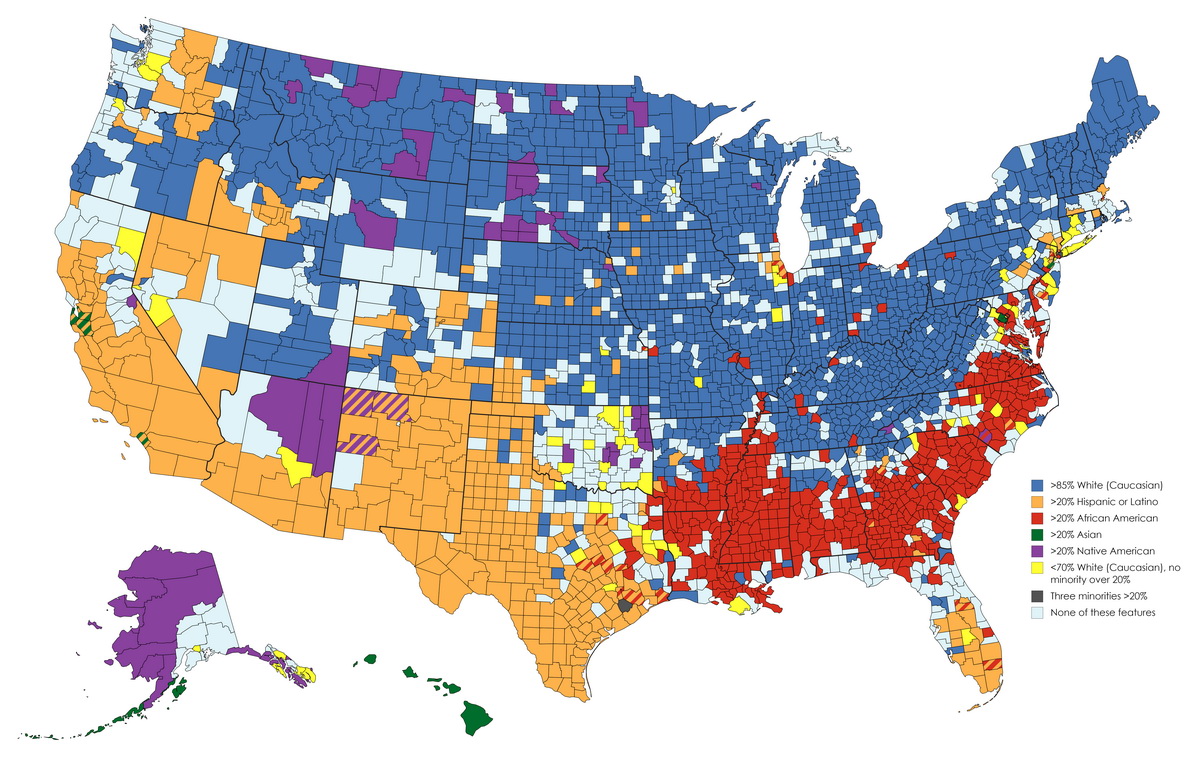
Before diving into the details of minority distribution, it’s essential to understand where white Americans still dominate demographically. The first map shows counties where the population is over 85% white, contrasted against those where at least one minority group exceeds 20%. This provides a broad overview of racial majorities and emerging minority strongholds.
A second map zooms in further, depicting counties where white Americans still make up at least 50% of the population versus those where they are in the minority (below 50%). This distinction highlights where demographic tipping points have already been reached.
Minority Presence and Expansion
Moving beyond white-majority counties, we look at where significant racial and ethnic minorities are concentrated. The third map categorizes U.S. counties by their most prominent minority group, illustrating where Hispanic/Latino, Black, Native American, and Asian populations are most prevalent.
While Black Americans have historically been concentrated in the Southeast due to the legacy of slavery and migration patterns, Hispanic populations have surged in the Southwest, reflecting both historical settlements and more recent immigration. Native American populations, meanwhile, are concentrated in areas aligned with reservations, particularly in the Great Plains and the Southwest.
Minority-Majority Counties
Perhaps the most telling shift is the growing number of counties where racial and ethnic minorities collectively outnumber whites. The final map in this post highlights counties where a single minority group comprises more than 50% of the population.
Black-majority counties remain common in parts of the Deep South, while Hispanic-majority counties are predominant in Texas, California, and New Mexico. Native American-majority counties are mostly found in the Southwest and the Northern Plains. These patterns reflect long-standing cultural and historical factors but also point toward evolving demographic trends.
The Changing Face of America
The transformation of the U.S. racial and ethnic landscape didn’t happen overnight. Immigration, birth rates, and internal migration have played key roles in shaping today’s demographics. The Hispanic population, for instance, has grown significantly due to immigration and higher birth rates compared to other groups. Similarly, Asian communities have expanded due to shifts in immigration policies since the 1960s.
Looking ahead, the number of minority-majority counties is expected to rise. According to projections by the U.S. Census Bureau, the U.S. is expected to become “minority white” by 2045, meaning non-Hispanic whites will make up less than 50% of the total population. Hispanic and Asian populations are seeing the most growth, particularly in states like California, Texas, and Florida, where many counties have already reached this demographic milestone.
These changes will have far-reaching implications, from politics and economic policies to cultural shifts and urban planning.