This regular election result map clearly shows who won in which U.S county, but this map doesn’t reveal the relative voting populations among each U.S. county. It can make people think that every county has an equal population.
If Each State’s Most Densely Populated County Decided the Winner
If Each State’s Least Densely Populated County Decided the Winner
Many people voted neither for Donald Trump nor for Hilary Clinton.
Voters who didn’t vote for Hillary or Trump
Reddit user: ChemAnon2018
In eight U.S. states, more than 10 percent of the voting population cast a ballot for someone other than Trump or Hillary.
Utah: 27%
Idaho: 13.25%
Vermont: 13.05%
Alaska: 12.17%
New Mexico: 11.7%
Wyoming: 10.97%
Oregon: 10.84%
Washington: 10.63%
What if “Didn’t Vote” were a candidate in the 2016 U.S. Presidential Election?
The map below represents vote populations and vote margins on a two-dimensional scale. The darker U.S. counties had more votes. The lighter U.S. counties had fewer votes.


")


The truth behind it the small towns and counties outnumber the major cities
How the Electoral Map would look if only ***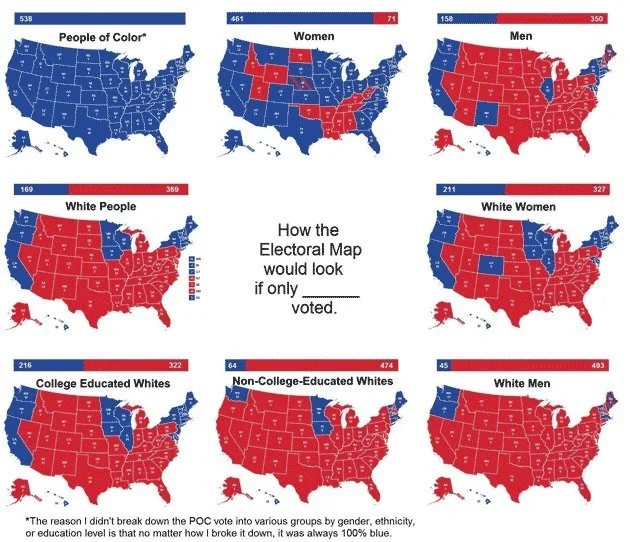 voted
voted