Using clouds to locate threatened species
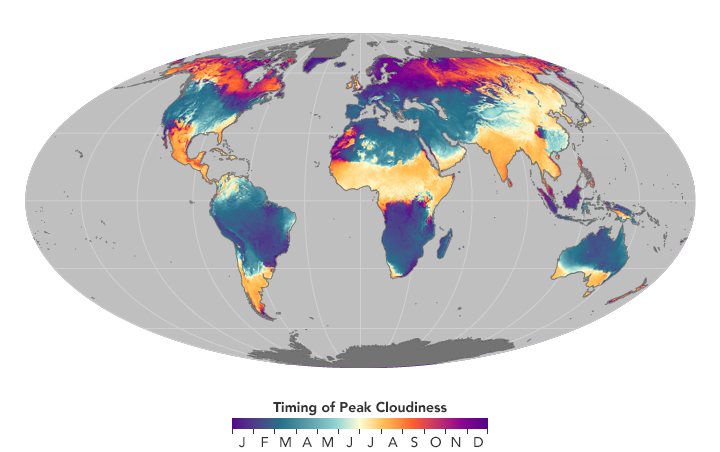
The world map (top right) is coloured according to month of peak cloudiness (top left). Areas of little seasonality are shown in black and areas of no data are dark grey. The panels from South America (bottom left) and South Africa (bottom right) show cloud cover corresponding to the borders of distinct ecoregions (marked in red) /Wilson & Jetz/
It can be hard to protect what you are unsure about. ‘For the regions that harbour most biodiversity there’s a real lack of data on the ground,’ says Walter Jetz, Associate Professor of Ecology and Evolutionary Biology at Yale University. In many cases, species can be elusive and hotspots can be isolated geographically. Enter clouds.
Clouds could provide an unconventional source of ecological information. Cloud cover influences growth, survival, behaviour and even the reproduction of species, so by mapping the Earth’s coverage, it is possible to locate ecological biomes with startling accuracy. After observing 15 years of satellite data, a team from the University of Buffalo has done just that. ‘When we visualised the data, it was remarkable how clearly you could see many different biomes on Earth,’ says Adam Wilson, co-author of the research and Professor of Geography at the University of Buffalo. ‘As you cross from one ecosystem to another, those transitions show up very clearly.’ The cloud maps, available to play with here, allow you to directly observe the transitions at a one kilometre resolution.
If you can understand the biome and its surroundings, you can be fairly confident of the species inside it. By referring to cloud cover, the team was able to determine the location and size of habitats for two test species: the montane woodcreeper (a South American bird) and king protea (a South African shrub) with unprecedented detail. Using this kind of remote sensing from satellite data allows biologists like Jetz to predict species distribution in hard-to-reach places. ‘That finding is particularly exciting because the technique could be used to research the habitats of threatened plants and animals,’ he says. ‘Understanding the spatial patterns of biodiversity is critical if we want to make informed decisions about how to protect species and manage biodiversity.’
‘We show that remote sensing combined with the right science can be an effective tool to help inform policy,’ says Wilson.
The map shows where cloud cover tends to be consistent throughout the year (white) and where it varies depending on the season (dark blue). Much of India, southern Africa, and northern Australia experience vast swings in cloudiness throughout the year.
The map shows the timing of peak cloudiness within a given year.
Via geographical.co.uk & nasa.gov


