Historical Maps
Historical maps showing territorial changes of countries and historical events of the past.
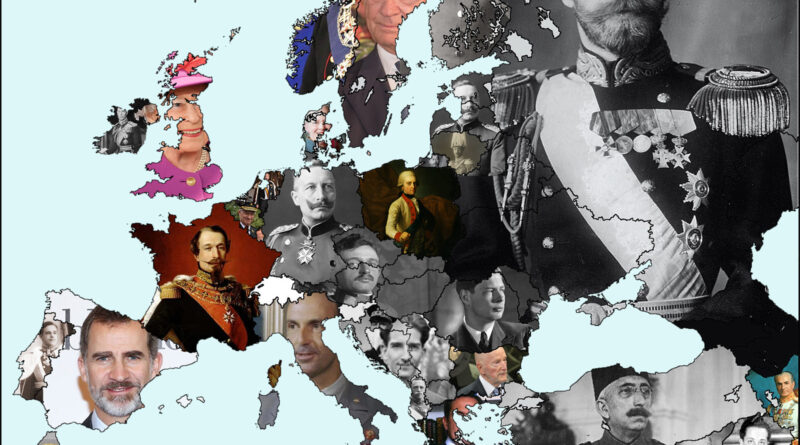
Monarchies in Europe
There are currently 12 monarchies in Europe: Andorra, Belgium, Denmark, Vatican, Liechtenstein, Luxembourg, Monaco, Netherlands, Norway, Spain, Sweden, and The United Kingdom. Six of them are members of the European Union (Belgium, Denmark, Luxembourg, the Netherlands, Spain, Sweden).
Read MoreThe Rise and Fall of Civilizations: An Animated Map of North American History
Discover the fascinating history of North America through an animated map, showcasing the rise and fall of civilizations, European colonization, and the formation of the United States from 1500 BC to today.
Read MoreHow America Achieved Full Marriage Equality
The history of same-sex marriage in the US. In 2004 Massachusetts was the first state to legalize same-sex marriage.
Read MoreWorld Population Cartograms
World Population Cartogram (1910) (1 square = 500,000 people) World Population Cartogram (2015) (1 square = 500,000 people) Countries combined
Read More