The New Cloud Atlas
The New Cloud Atlas is a global effort to map each data place that makes up the cloud in an
Read More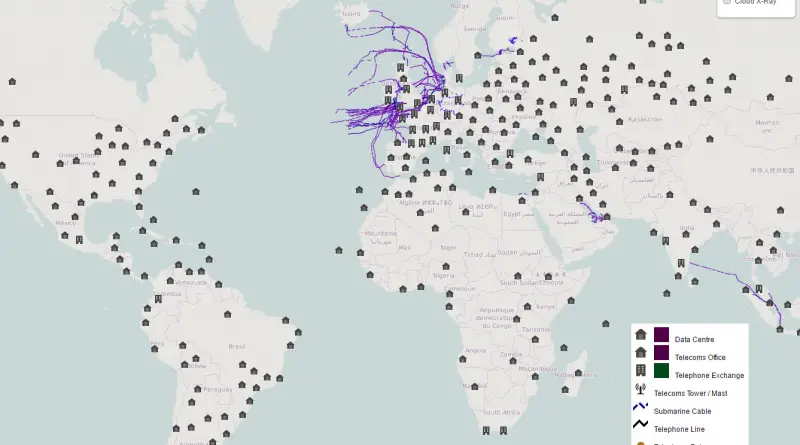
The New Cloud Atlas is a global effort to map each data place that makes up the cloud in an
Read MoreThe potential for solar photovoltaic energy systems based on information about buildings in Minneapolis.
Read MoreHeat map of OSM Activity around the world.
Read More
Netafilter has been built on top of MyNeta’s database which contains data of the educational qualifications, net assests owned and
Read MoreListen to what people in over a thousand cities are uniquely into now. Relates post: – World Radio Map
Read MoreThe most commonly diagnosed cancers vary by country, especially for males, with prostate and lung cancers occurring most often. For females, breast and cervical cancers happen most frequently. Although higher-income countries lead the world in cancer incidence, lower-to-middle-income countries present the highest rates of infection-related cancers, such as stomach, liver and cervical cancers.
Read MoreSurveillance under Surveillance shows you cameras and guards — watching you — almost everywhere. You can see where they are
Read MoreWithin the Downtown and East York regions of Toronto, during 2015 enforcement officers issued over $68.6 million in parking fines
Read More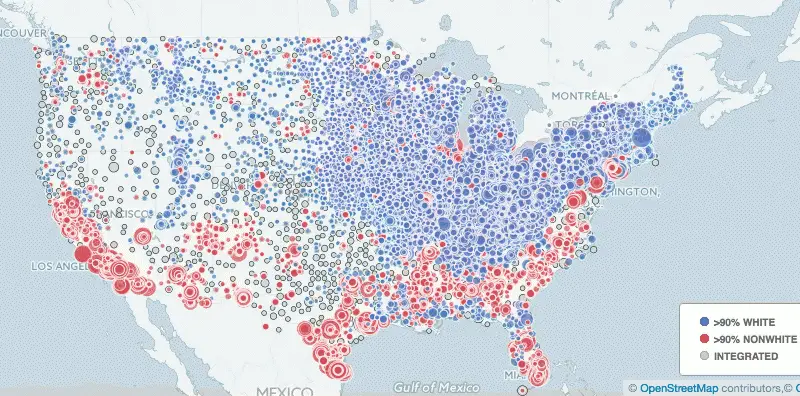
Based on an analysis we conducted of data from the National Center for Educational Statistics, we found that approximately a
Read MoreAnnual aircraft departures (thousands). via chartsbin.com
Read More