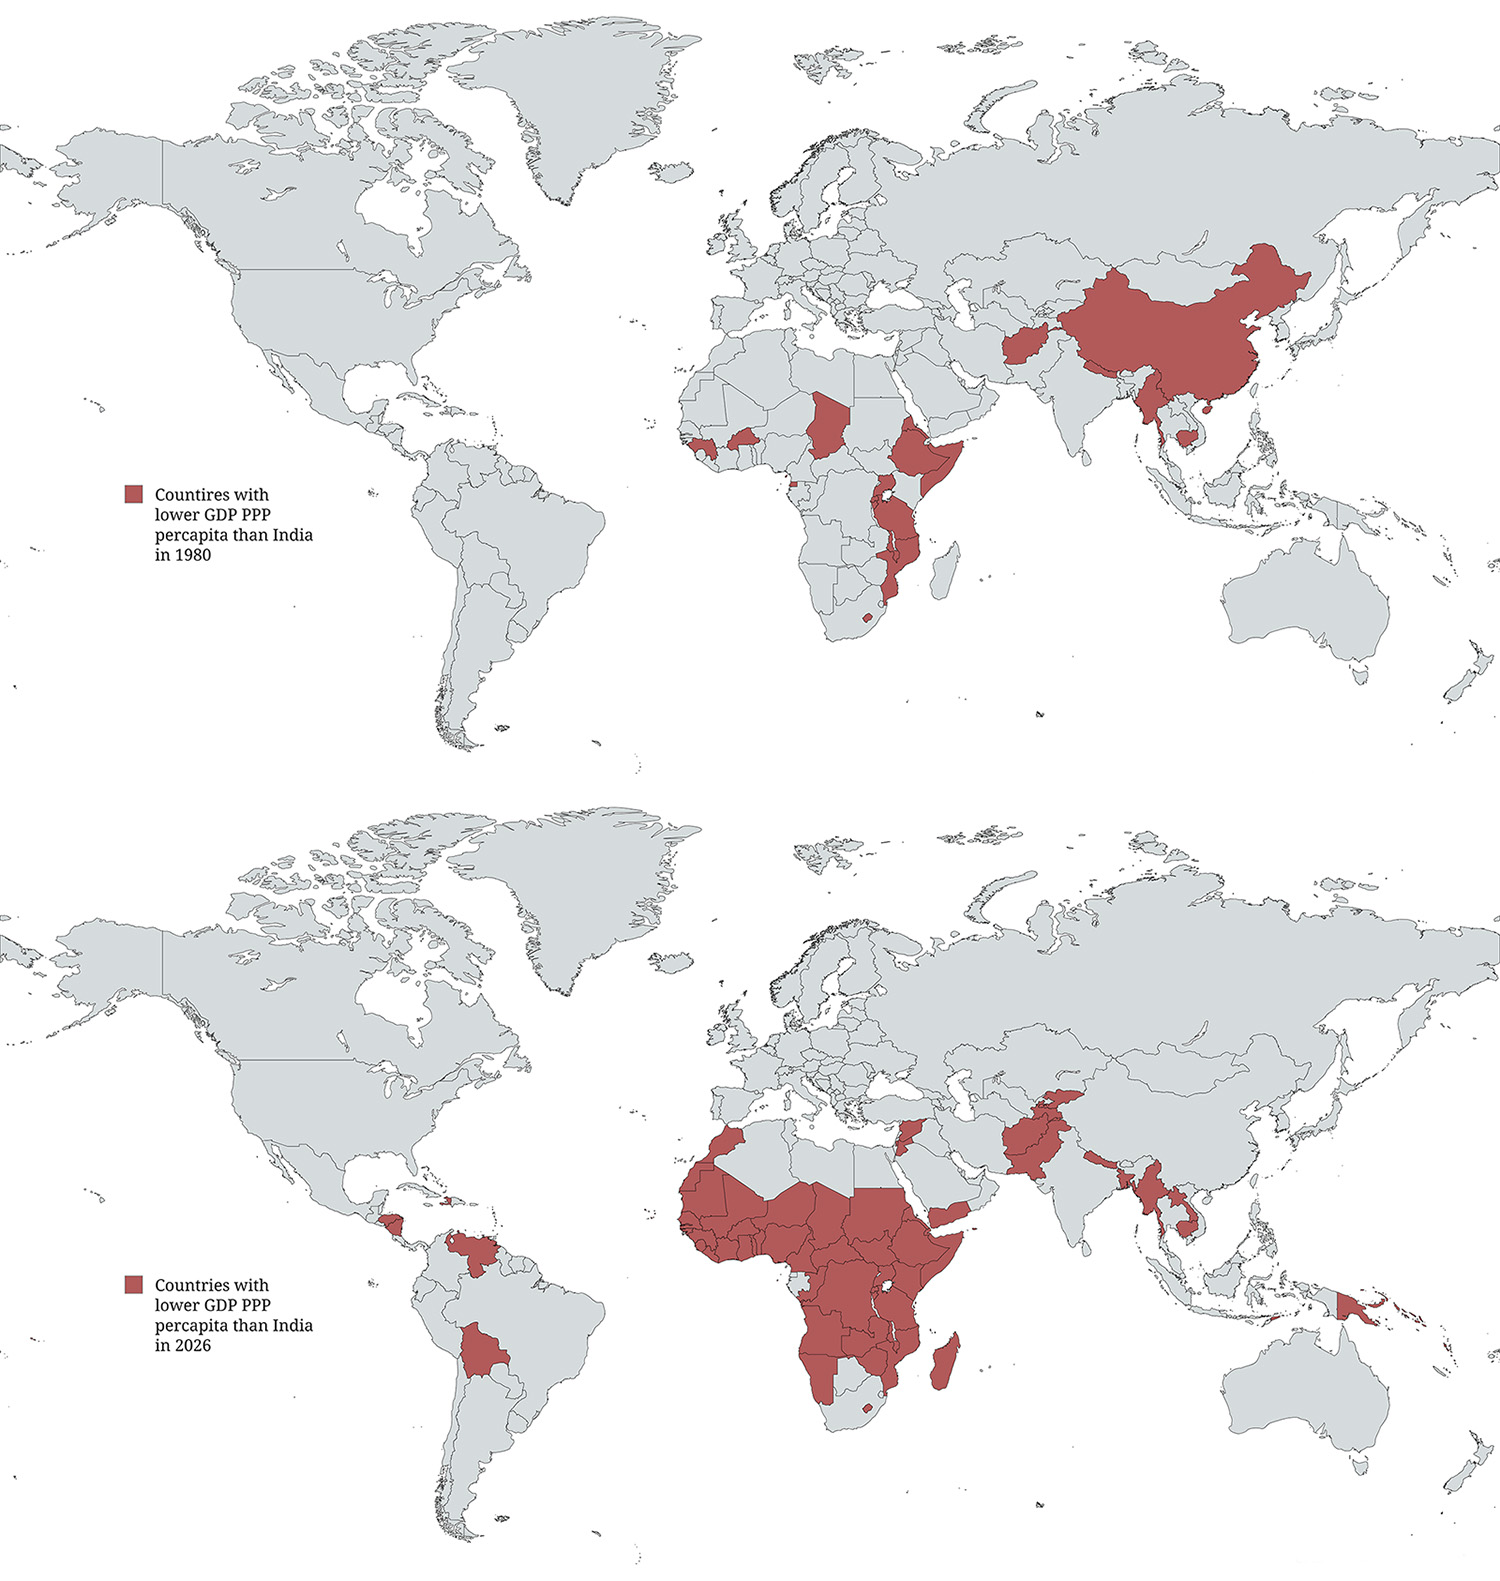
Raising living standards is hard enough for any government. Doing it for 1.4 billion people is a problem most countries will never face. India became the world’s most populous country in 2023 after overtaking China, and that scale has always complicated its economic path in a specific, practical way. Whatever an economy produces gets divided among its entire population. The larger that population, the harder it becomes to move the per capita average upward, even when total growth looks healthy. Smaller countries can shift their average income figures within a generation. India has to do the same across a population that dwarfs most nations on Earth. These two maps show what four decades of that effort have produced.
In 1980, fewer than 13 countries had a lower per capita GDP (PPP) than India’s $533. Most were in sub-Saharan Africa. China was also on that list at $275. The IMF puts India’s 2026 figure at $12,964 — around 24 times higher than where it started.
Countries with Lower GDP (PPP) per Capita than India in 1980
Country
GDP (PPP) per Capita
Mozambique
197
China
275
Equatorial Guinea
335
Ethiopia
367
Burundi
383
Burkina Faso
385
Malawi
412
Uganda
416
Rwanda
420
Lesotho
422
Nepal
493
Chad
502
Tanzania
505
In 1980, India was running what became known as the License Raj, a system where businesses needed government approval for practically every significant decision. Private investment moved slowly, and foreign capital had little reason to come in. The shift didn’t arrive through careful policy planning. In 1991, foreign exchange reserves fell low enough that India had only weeks of import cover left, and opening the economy became unavoidable rather than optional. Foreign capital came in, IT companies reached international clients they’d never had access to before, and annual growth of 6 to 7 percent became the new baseline.
Countries with Lower GDP (PPP) per Capita than India in 2026
Country
GDP (PPP) per Capita
Burundi
1,017
South Sudan
1,154
Central African Republic
1,393
Mozambique
1,776
Malawi
1,787
Somalia
1,941
Liberia
2,061
DR Congo
2,050
Madagascar
2,108
Niger
2,195
Afghanistan
2,201
Sudan
2,627
Solomon Islands
2,786
Mali
3,009
Haiti
2,954
Vanuatu
3,032
Burkina Faso
3,147
Lesotho
3,142
Chad
3,236
Guinea-Bissau
3,435
Togo
3,536
Gambia
3,822
Sierra Leone
3,870
Kiribati
3,833
Papua New Guinea
3,882
Uganda
4,131
Comoros
4,160
Rwanda
4,391
Tanzania
4,595
Ethiopia
4,743
Zambia
4,750
Benin
4,982
Guinea
5,213
Myanmar
5,168
Timor-Leste
5,112
Senegal
5,464
Micronesia
4,913
Syria
4,650
Cameroon
5,960
Tajikistan
6,434
Nepal
6,578
Tuvalu
6,412
São Tomé and Príncipe
6,752
Congo
6,635
Pakistan
7,190
Kenya
7,929
Marshall Islands
8,415
Honduras
8,238
Tonga
8,445
Ivory Coast
8,543
Samoa
8,626
Ghana
8,813
Cambodia
9,126
Mauritania
9,112
Kyrgyzstan
9,318
Nicaragua
9,402
Djibouti
10,030
Nigeria
9,861
Laos
10,520
Angola
10,257
Bangladesh
10,847
Around 60 countries now fall below India’s projected figure. Bangladesh is at $10,847, Pakistan at $7,190, Indonesia ahead at $18,657. China at $31,023 is a different category altogether — particularly worth noting given that it sat below India in 1980.
Deng Xiaoping began opening China’s planned economy in 1978. India made its comparable move in 1991, pushed there by a crisis. Those 13 extra years gave China time to build manufacturing zones along its coastline, keep household savings near 45 percent of GDP, and put that capital into infrastructure at a scale India wasn’t close to matching. In 2001, China joined the WTO, which connected its already-mature industrial base to global markets at full speed. India’s growth ran mainly through software and services — real and significant, but drawing in a narrower share of the workforce.
Africa is harder to summarize. Burundi is at $1,017 in 2026 and Ethiopia at $4,743 — both were sitting in much the same income bracket as India back in 1980. Several things have held most of the continent back since then. Repeated civil wars and coups in countries like DR Congo and Sudan wiped out growth that took years to build. Oil and mineral wealth, where it existed, tended to generate volatility and corruption rather than broad development — Nigeria being the most obvious case. Heavy external debt and reliance on foreign aid meant governments had little left over to spend on schools, hospitals, and electricity networks. Getting those basics right takes decades, and without them productivity stays low — sub-Saharan Africa’s average literacy rate of around 60 percent against India’s 75 percent is one measure of that gap. Geography hasn’t helped either: landlocked countries like Burkina Faso pay far more to move goods in and out, and large parts of the continent deal with drought and crop failures that would stretch any budget. India, meanwhile, was receiving around $100 billion annually in diaspora remittances and growing an IT sector that brought foreign investment in rather than depending on aid flowing out. Rwanda, projected at $4,391 in 2026, is a real counterexample — two decades of focused reform have made a measurable difference there. For most of the continent, progress has been slower and the conditions more resistant to change.