Food insecurity is a pressing issue in the United States, affecting millions of households annually. In 2023, 13.5% of U.S. households faced food insecurity, highlighting an increase from 12.8% in 2022. This trend underscores the challenges many Americans face in securing consistent access to sufficient and nutritious food. To better grasp the scale and distribution of this issue, the USDA Economic Research Service (ERS) provides detailed maps and data, offering valuable insights into where food insecurity rates exceed or fall below the national average.
Food Security and Insecurity: What the Numbers Reveal
According to USDA statistics, 86.5% of U.S. households were food secure in 2023, a slight decline from 87.2% in 2022. Food insecurity impacted 18 million households, including 6.8 million categorized as having very low food security. These households often faced disrupted eating patterns and reduced food intake due to economic hardships.
Households with children were particularly vulnerable. Approximately 17.9% of these households experienced food insecurity, and in 1% of cases, children faced reduced food intake. While adults often shield children from the worst impacts, the existence of child hunger highlights the gravity of food insecurity for families.
Regional and State Variations in Food Insecurity
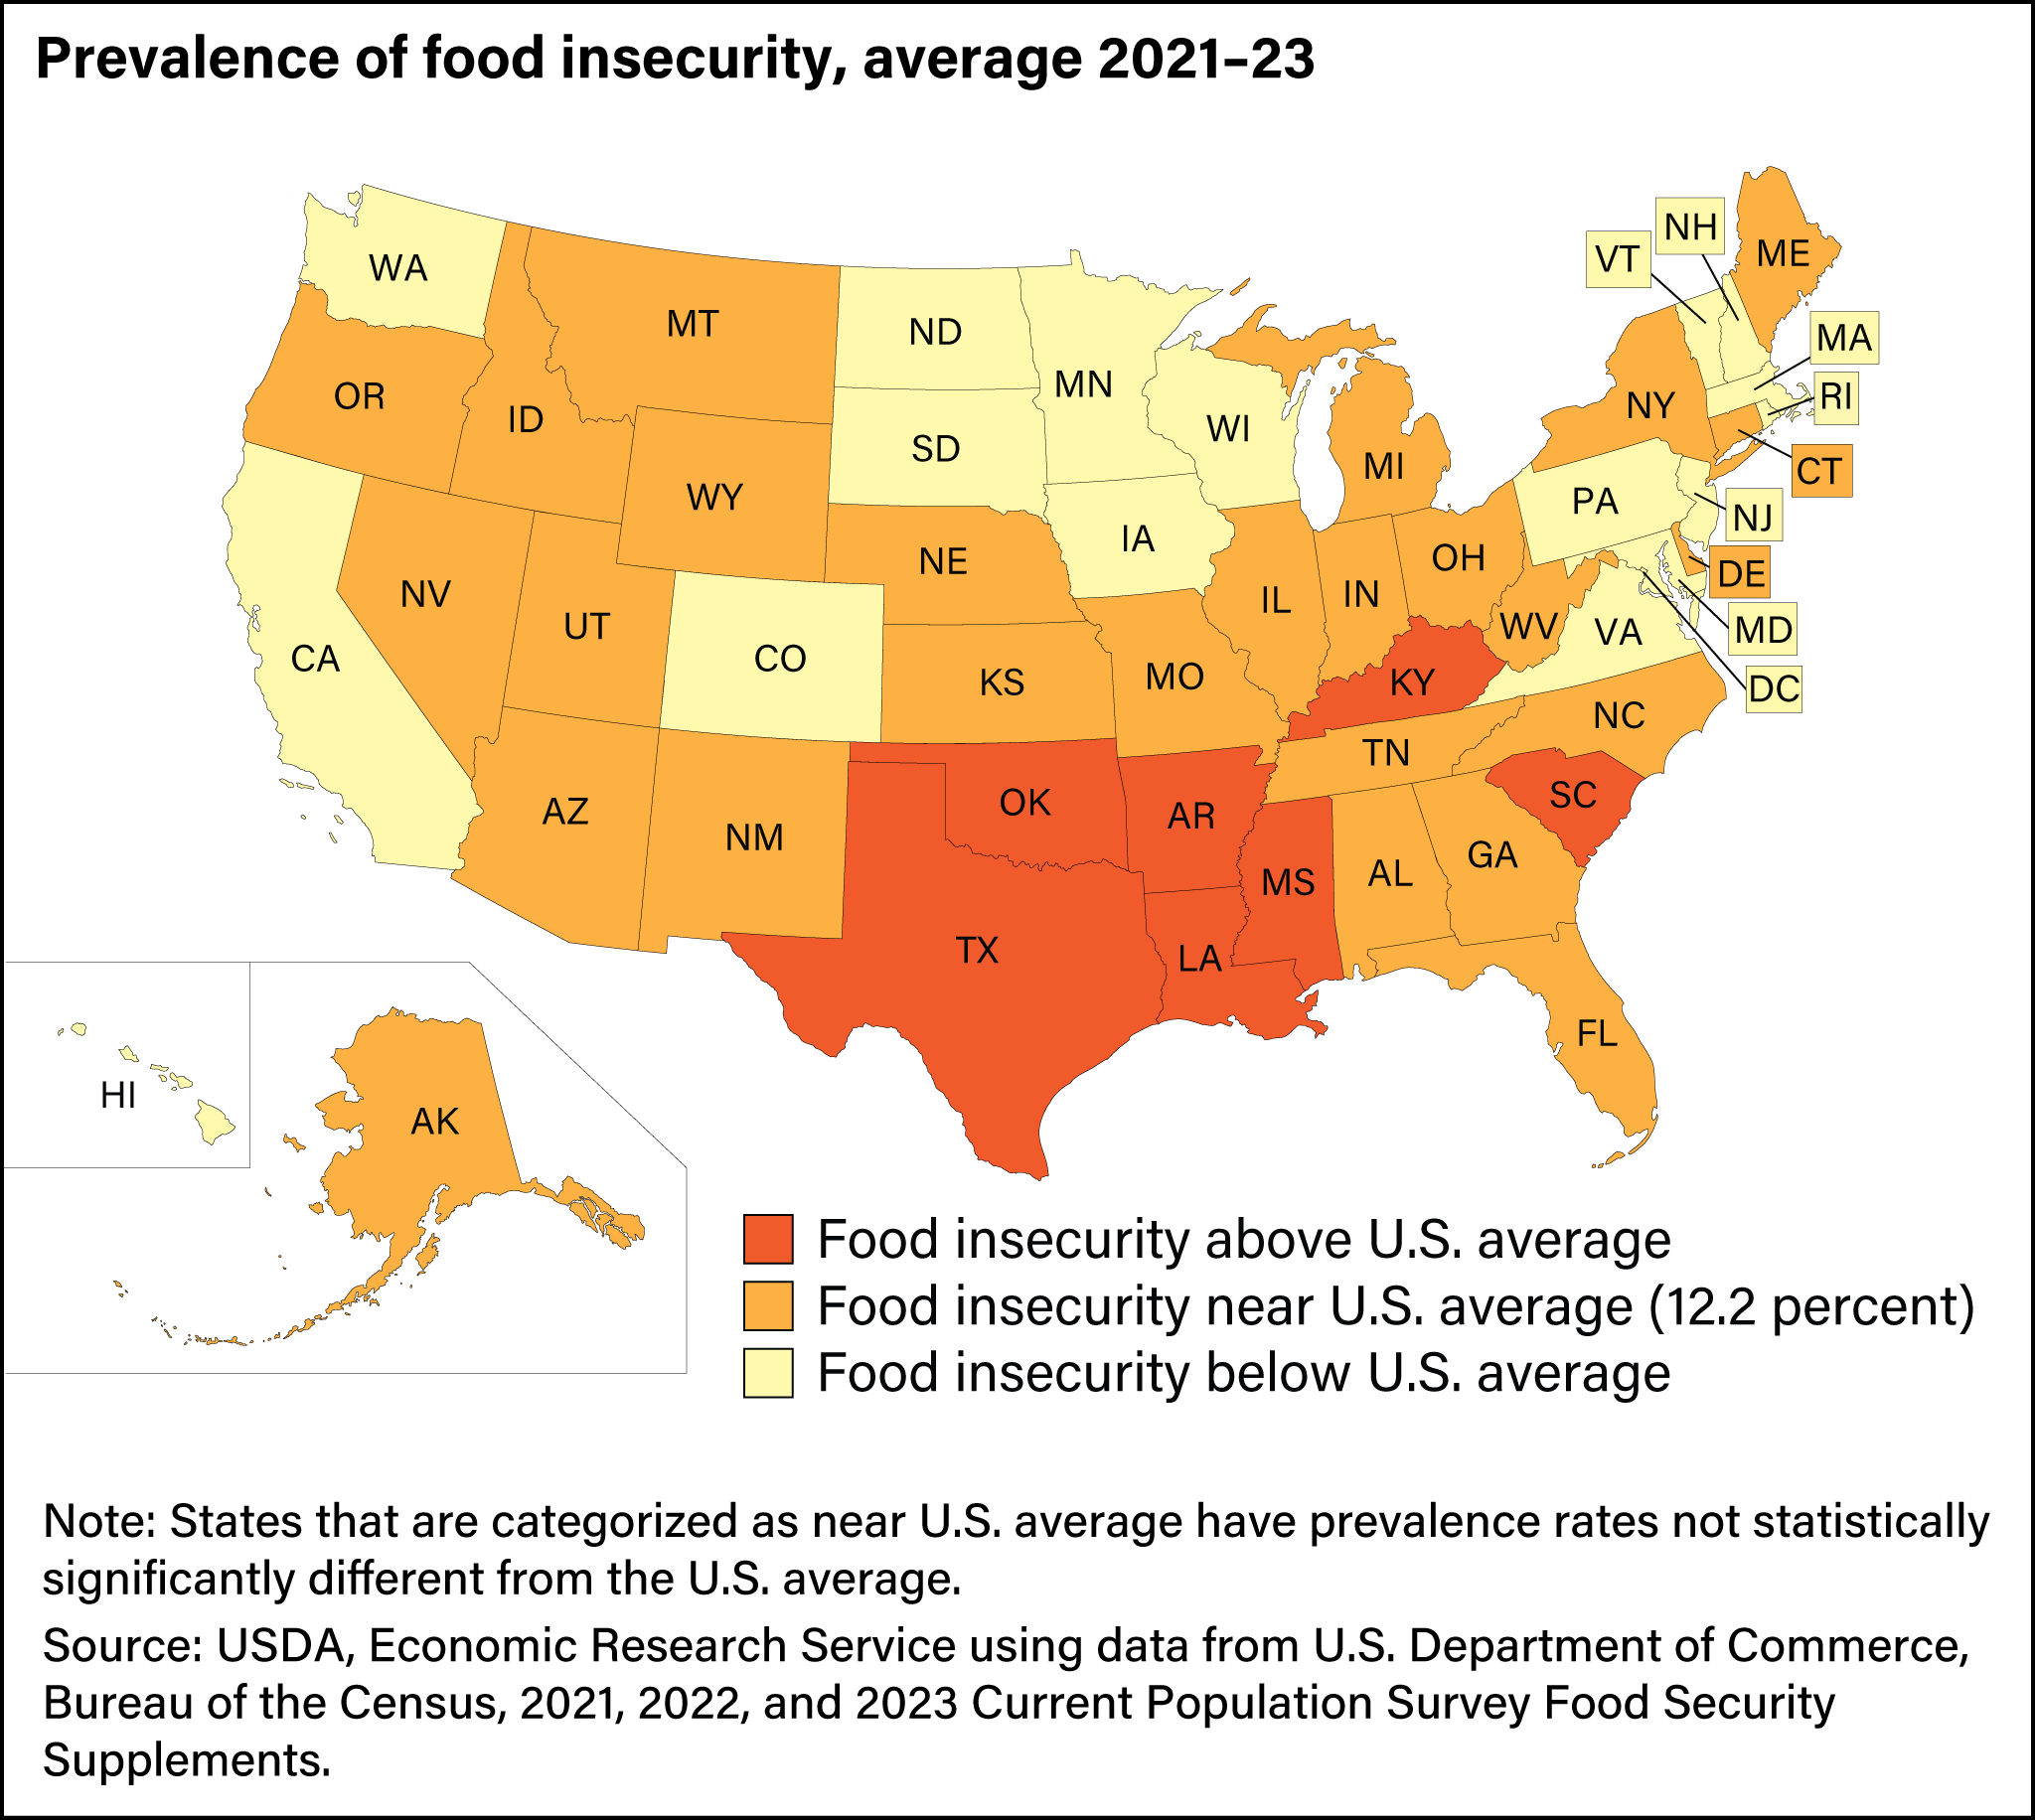
Food insecurity is not evenly distributed across the country. The USDA’s map, derived from 2021–2023 data, illustrates significant state-level disparities. For example, food insecurity rates were as low as 7.4% in New Hampshire but soared to 18.9% in Arkansas. Similarly, very low food security ranged from 3.2% in states like Iowa and North Dakota to 7.0% in South Carolina.
This map, created by the USDA Economic Research Service, visually represents food insecurity prevalence, helping policymakers and communities identify areas requiring intervention.
The Bigger Picture: Trends Over Time
The prevalence of food insecurity in the U.S. has fluctuated over the years. Between 2010 and 2014, food insecurity rates were notably higher, exceeding 14%. In contrast, rates dropped below 11% between 2018 and 2020, reflecting improved economic conditions. However, the uptick in 2023 signals the lingering impacts of inflation and economic uncertainty on American households.
Food insecurity remains a critical challenge, and addressing it requires collective effort. How does food insecurity impact your community, and what solutions have you seen that work? Share your thoughts in the comments below.
If you are interested in maps of the United States for your home or office, consider browsing options available on Amazon. From educational posters to decorative pieces, these maps cater to a variety of needs while enhancing your understanding of America’s geography and demographics.


Some of these areas have a very low population, dry and arid.