Data analyst Alasdair Rae created unique 3D maps of the global population density. This idea inspired me to make three-dimensional maps depicting different climatic parameters. To create these maps, I used Worldclim data: average temperature (°C), precipitation (mm), solar radiation (kJ m-2 day-1), and wind speed (m s-1).
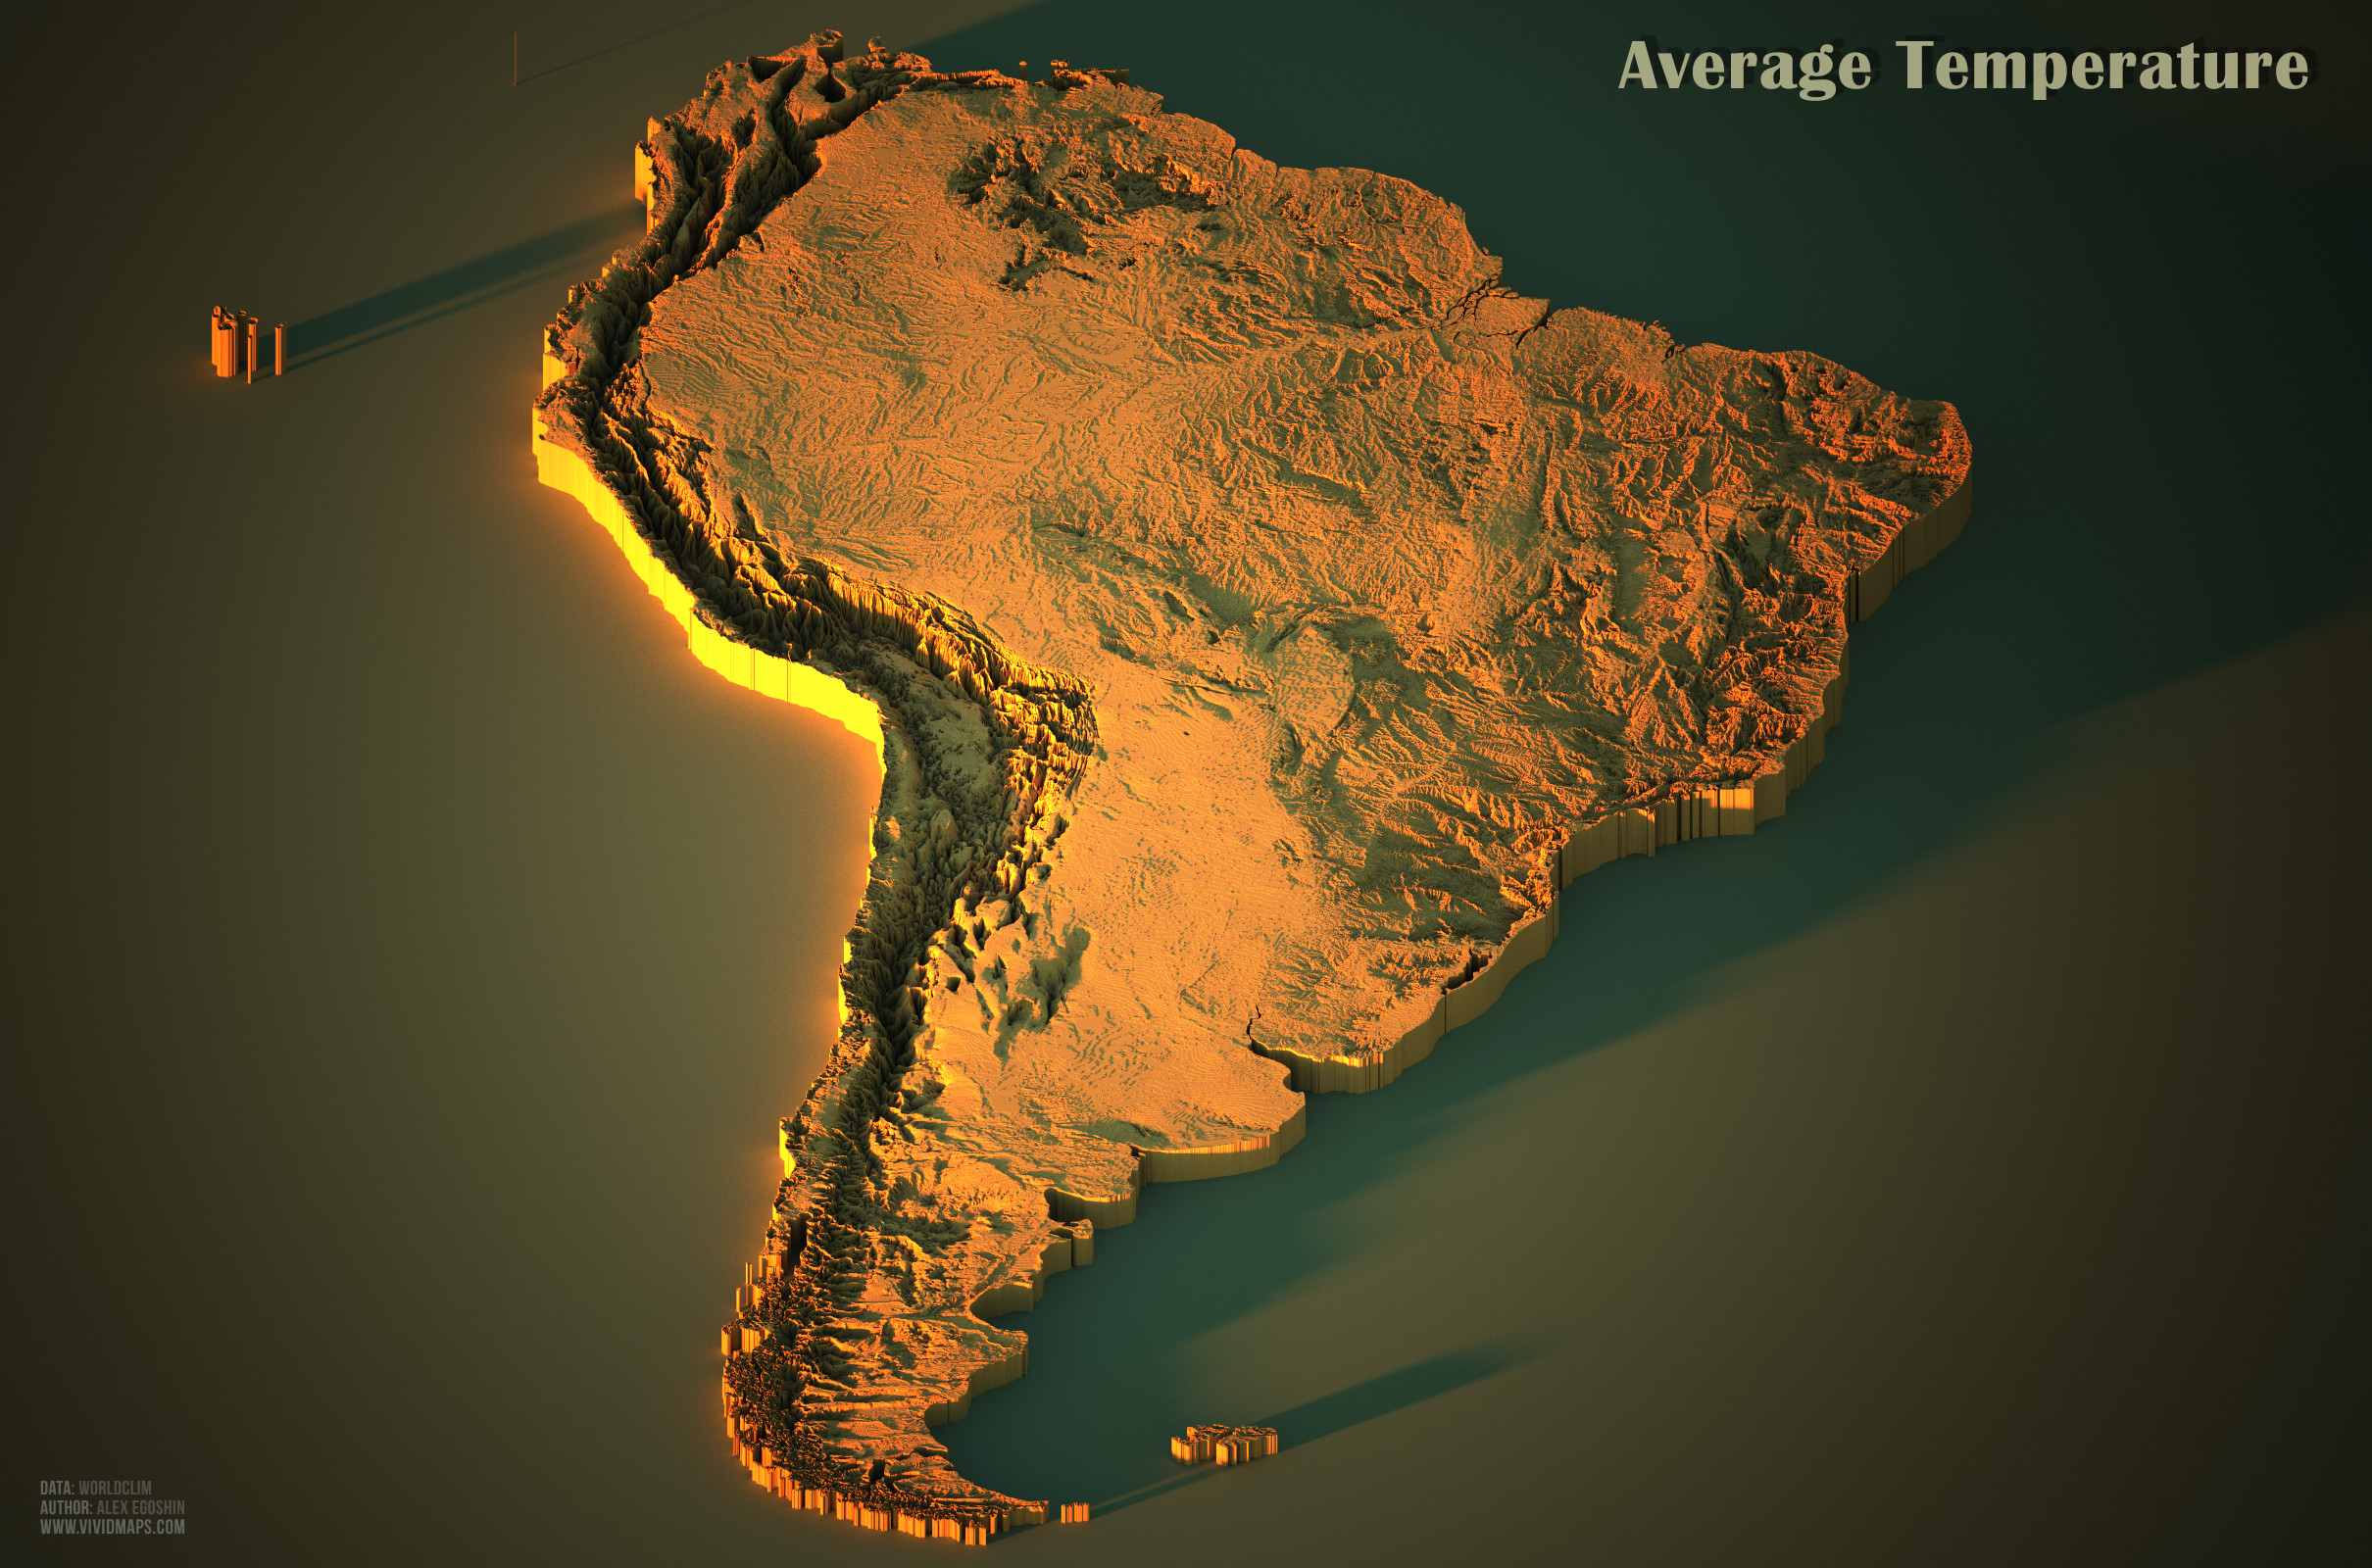
The average Earth’s surface temperature is 14.9°C (58.62°F), but the temperature is unevenly distributed on the planet’s surface. The patterns of temperature distribution on the maps below are mostly latitudinal. However, the latitudinal banding is partly disturbed because water bodies are usually warmer than land surfaces. The maps below also show the influence of altitude (especially the Himalayas, Cordillera, and Andes mountains).
North America
The annual average temperatures in the Northern American Cordillera are very diverse.
North American Cordillera
South America
Europe
Africa
Asia
Australia
Precipitation
The globally averaged annual precipitation is 100 centimeters (39 inches), but this is distributed quite unevenly. Overland, the average yearly precipitation is only 715 millimeters (28.1 inches). On a large scale, the highest rainfall territories are located in the equatorial zone and Southeast Asia’s monsoon region. Middle latitudes get moderate volumes of precipitation, and the subtropics’ desert regions and polar regions receive the least amount of precipitation.
North America
Annual precipitation totals about 4 thousand millimeters in Alaska’s southern chains and up to 2.5 thousand millimeters along the coast of British Columbia, lowering to 300 millimeters in the United States’ inner plains.
North American Cordillera
South America
Mountain territories near the equator in Colombia are amongst the wettest areas on our planet.
Mountain territories near the equator in Ecuador and Colombia
Europe
Africa
Asia
Australia
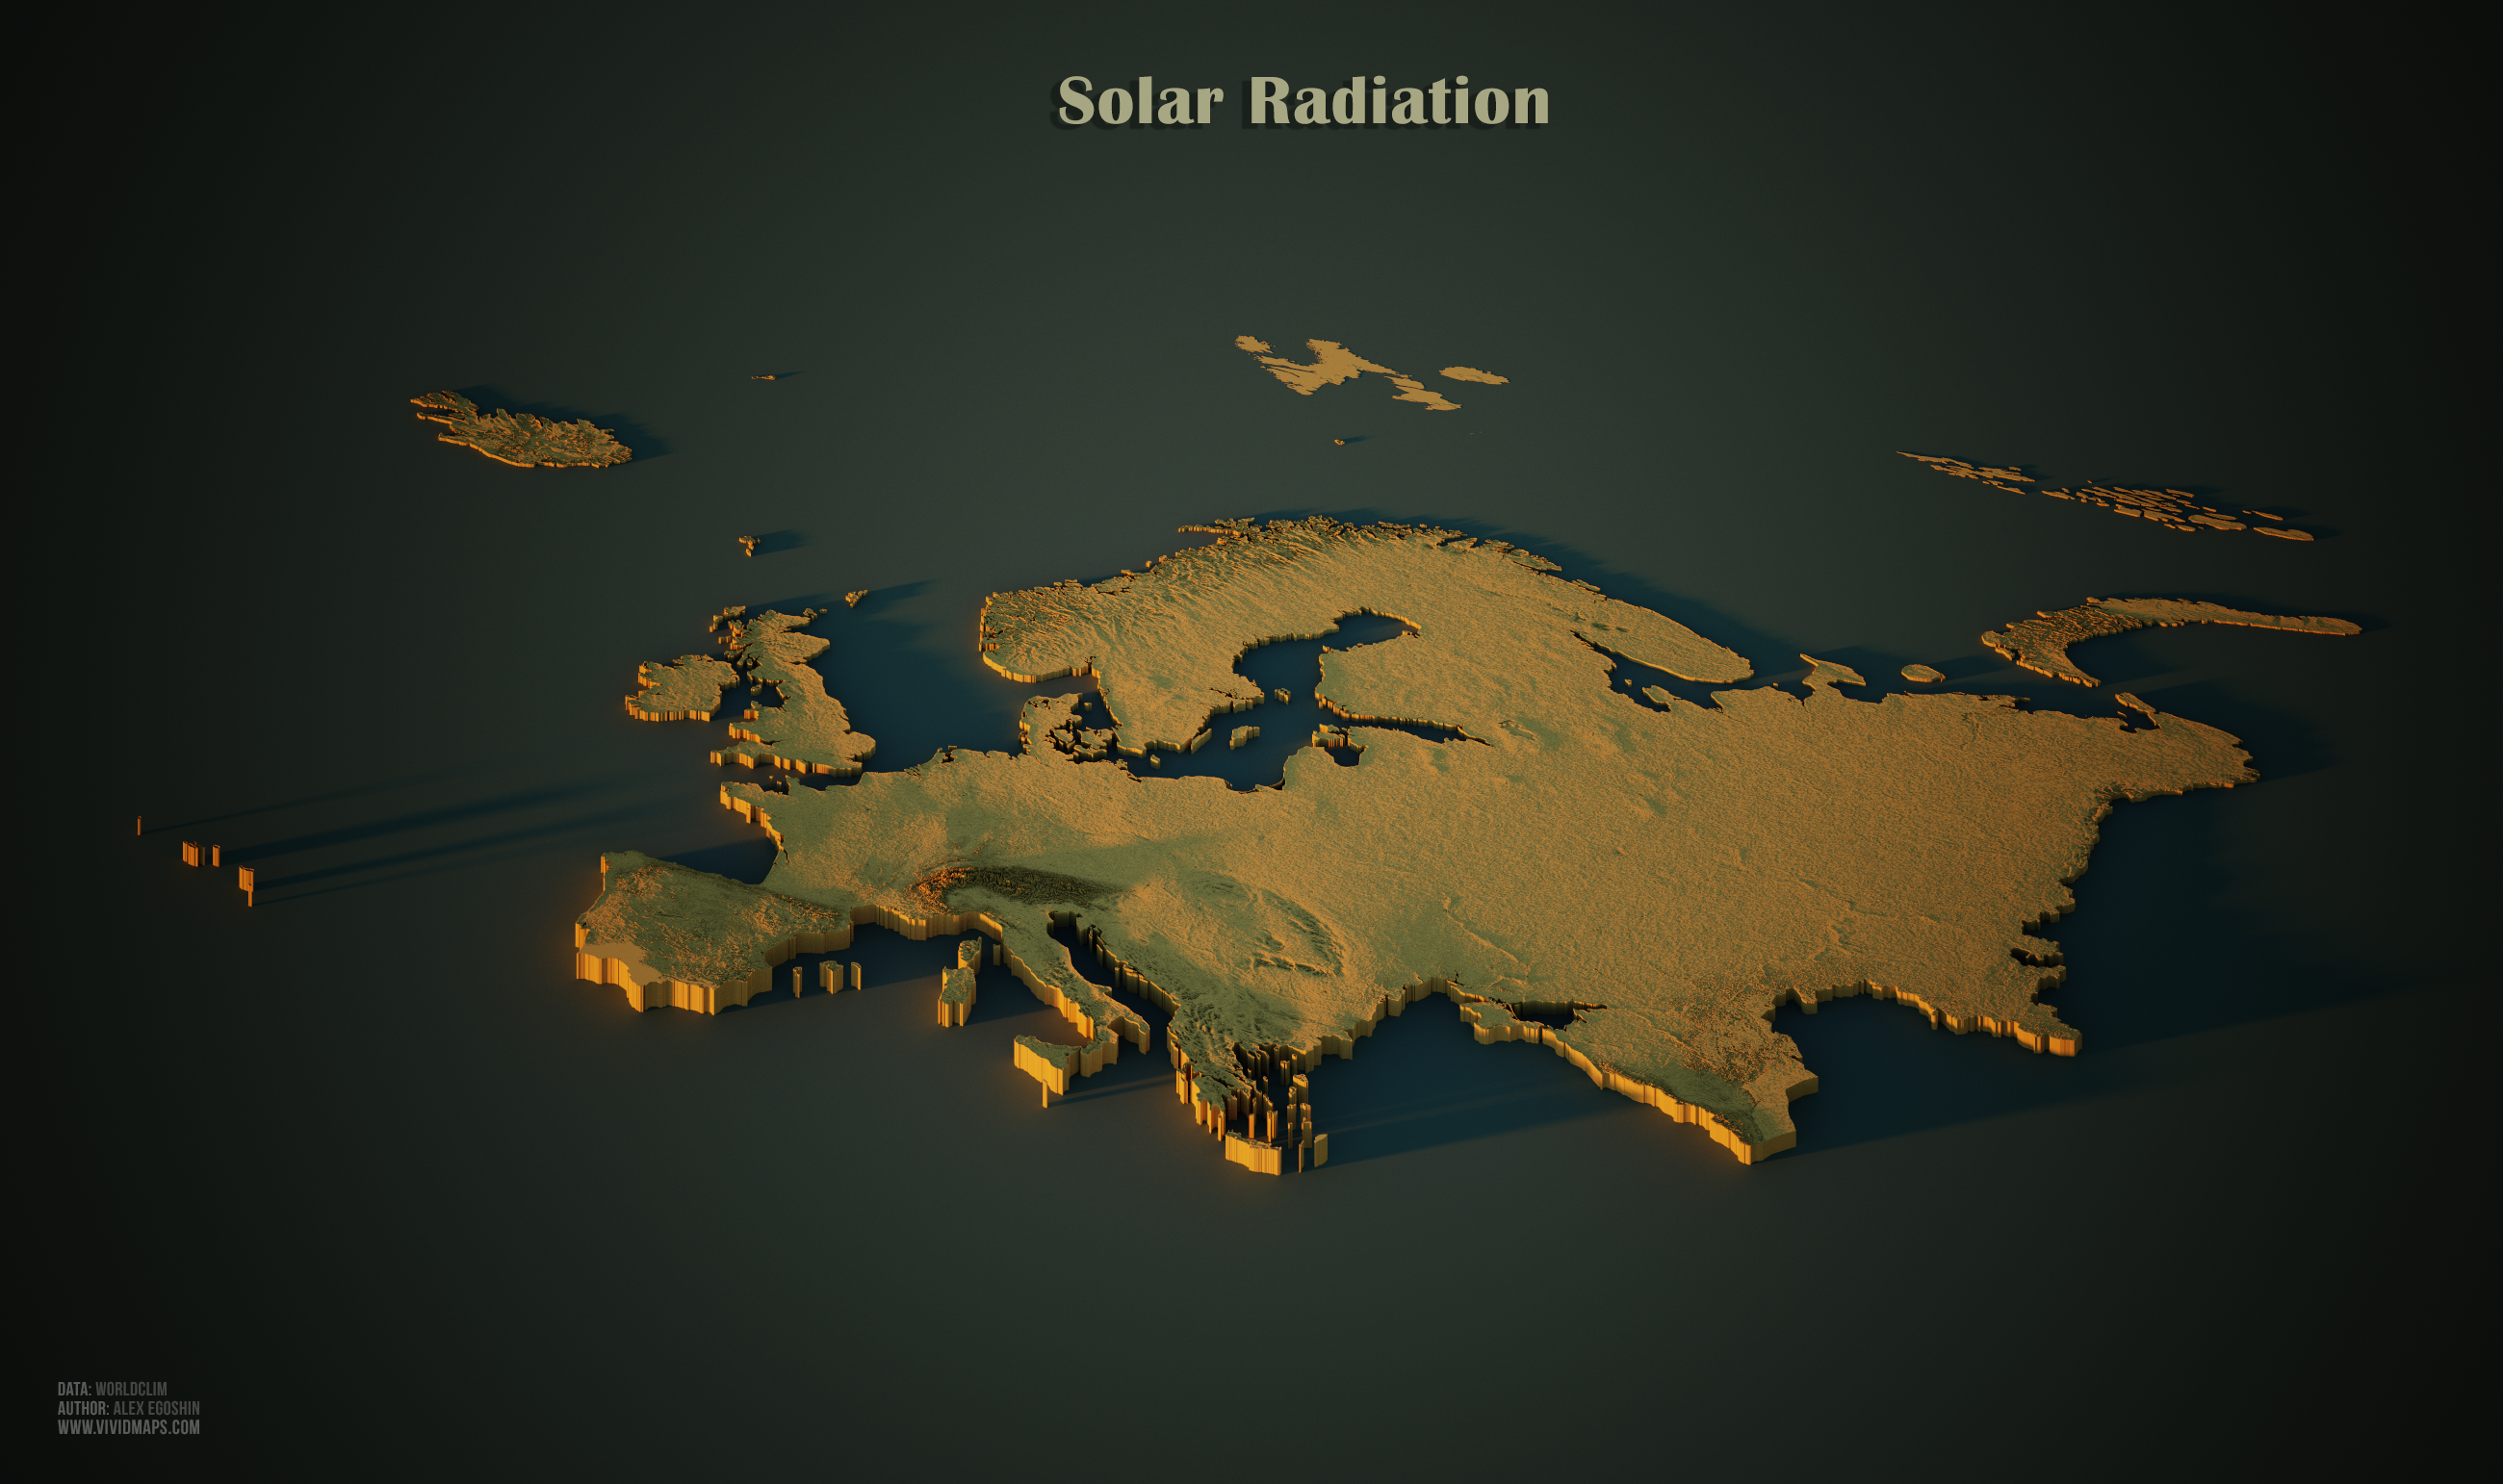
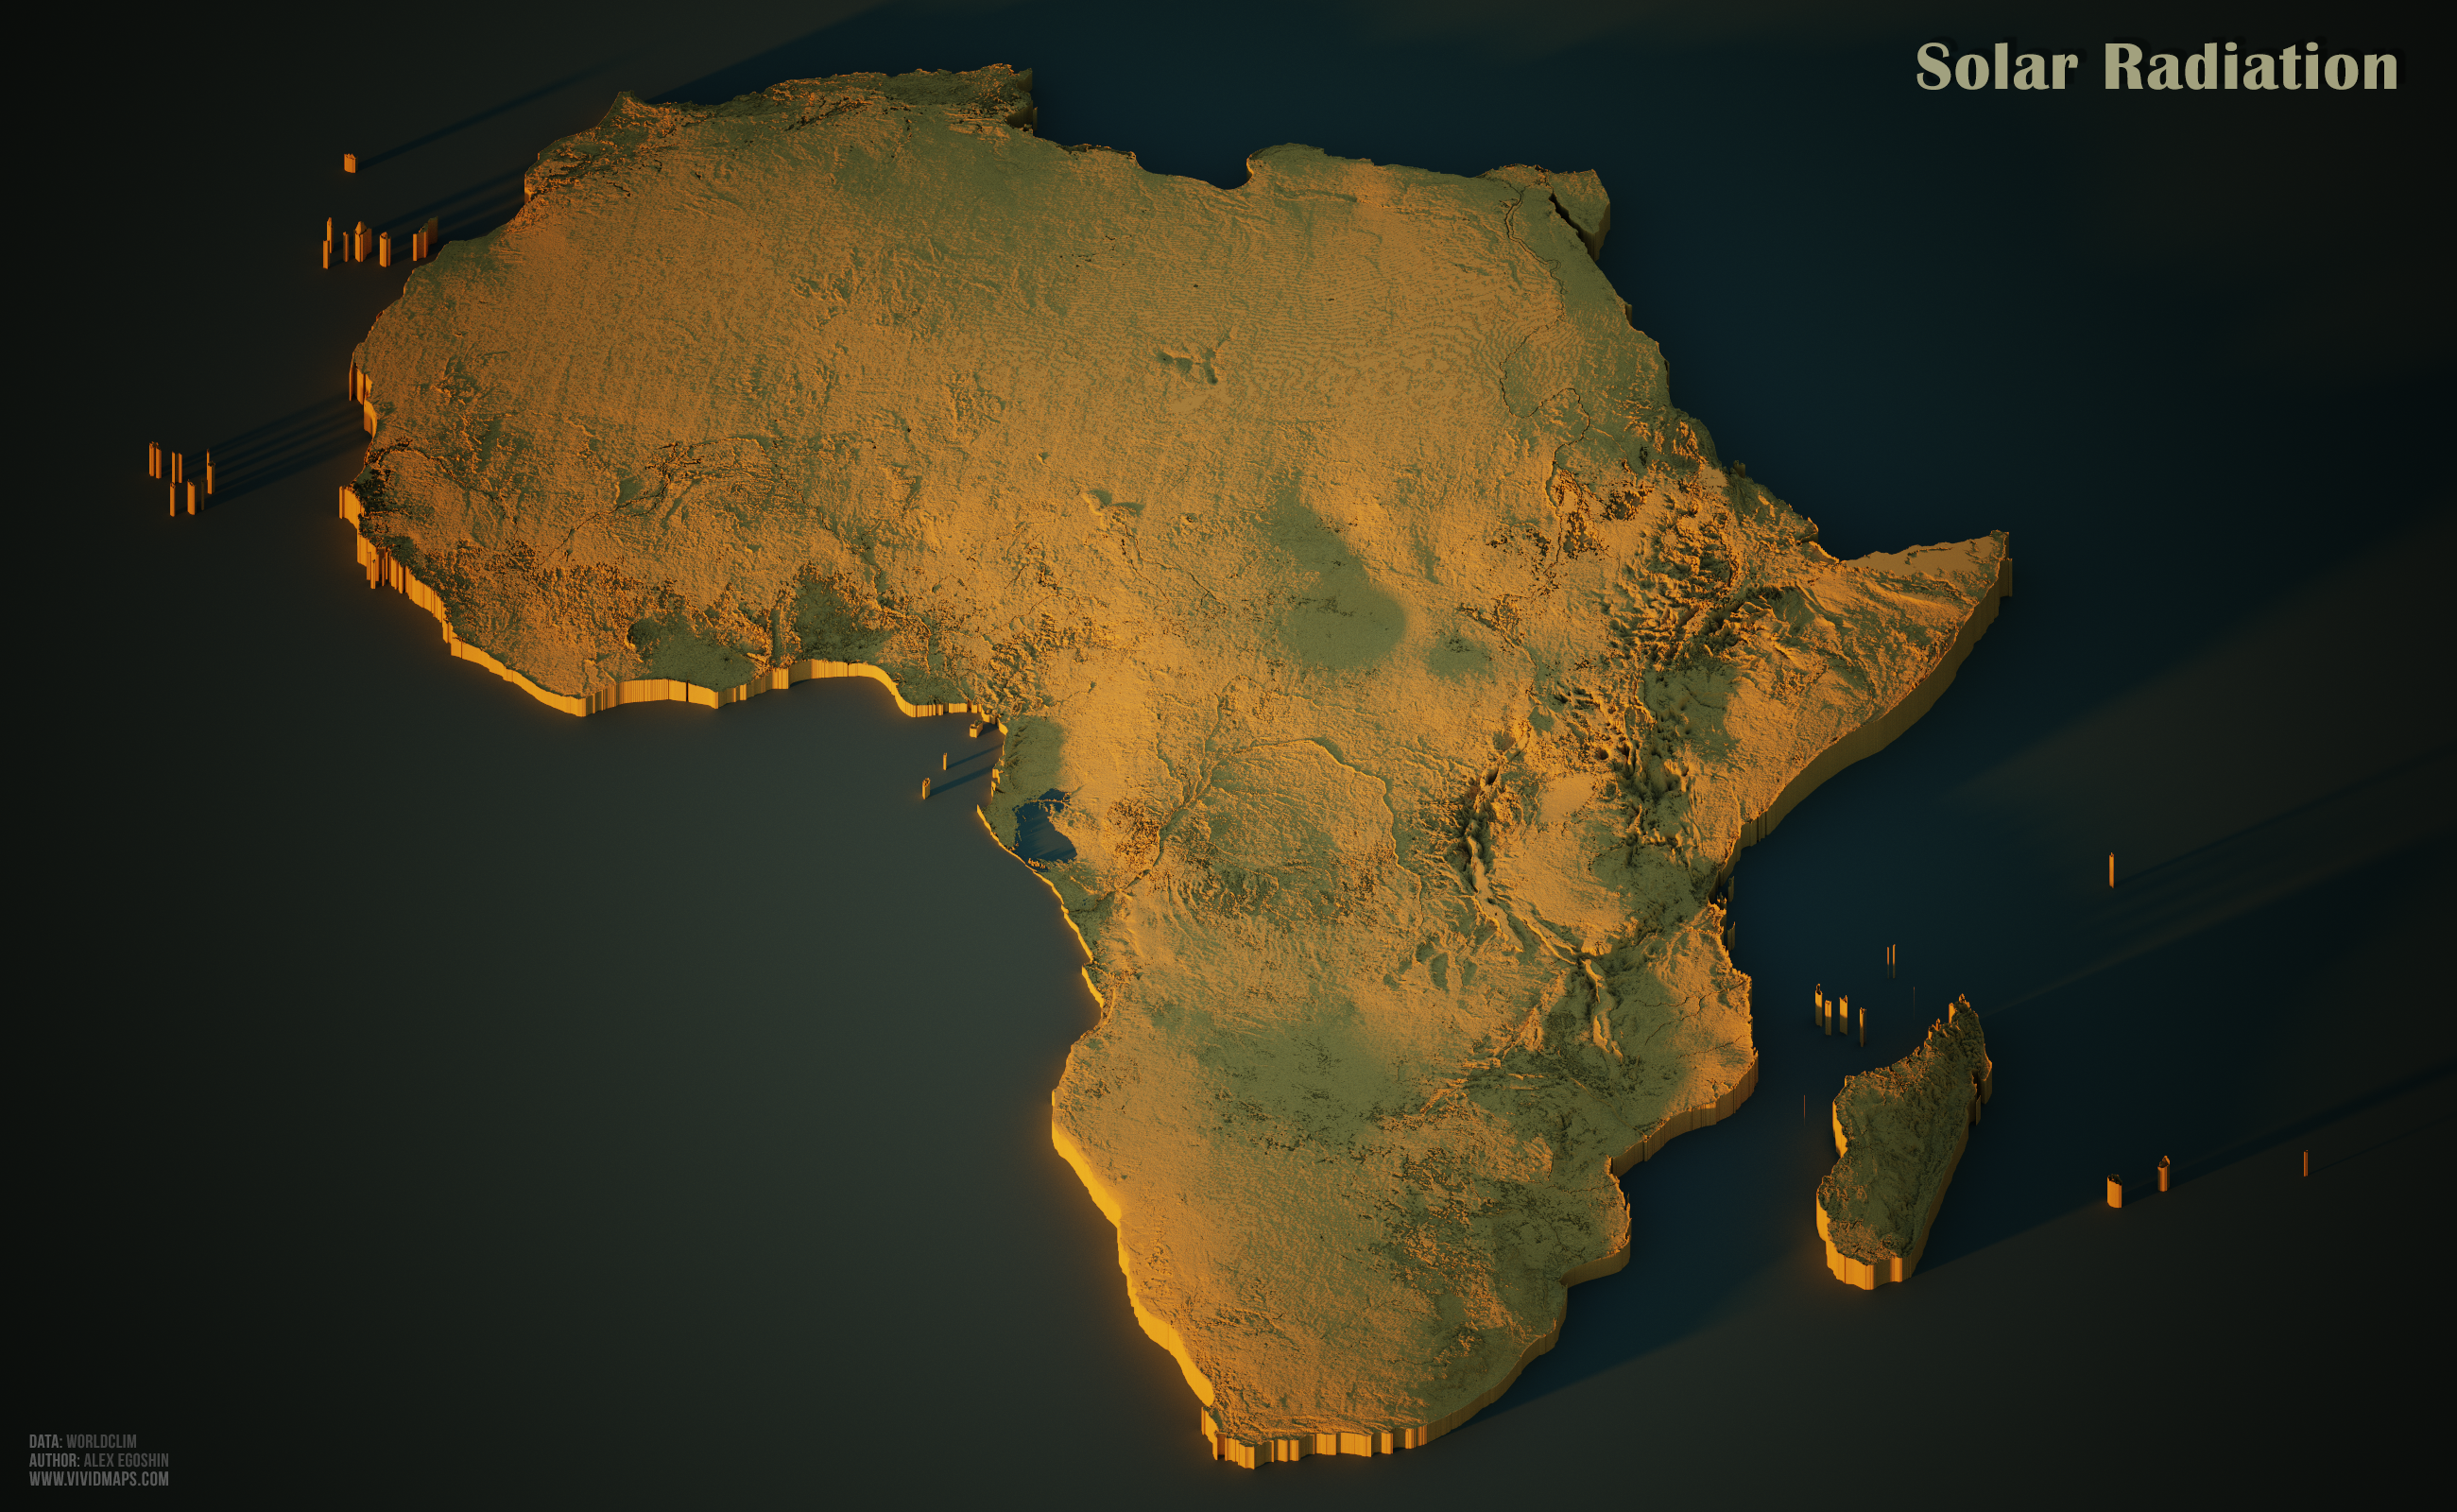
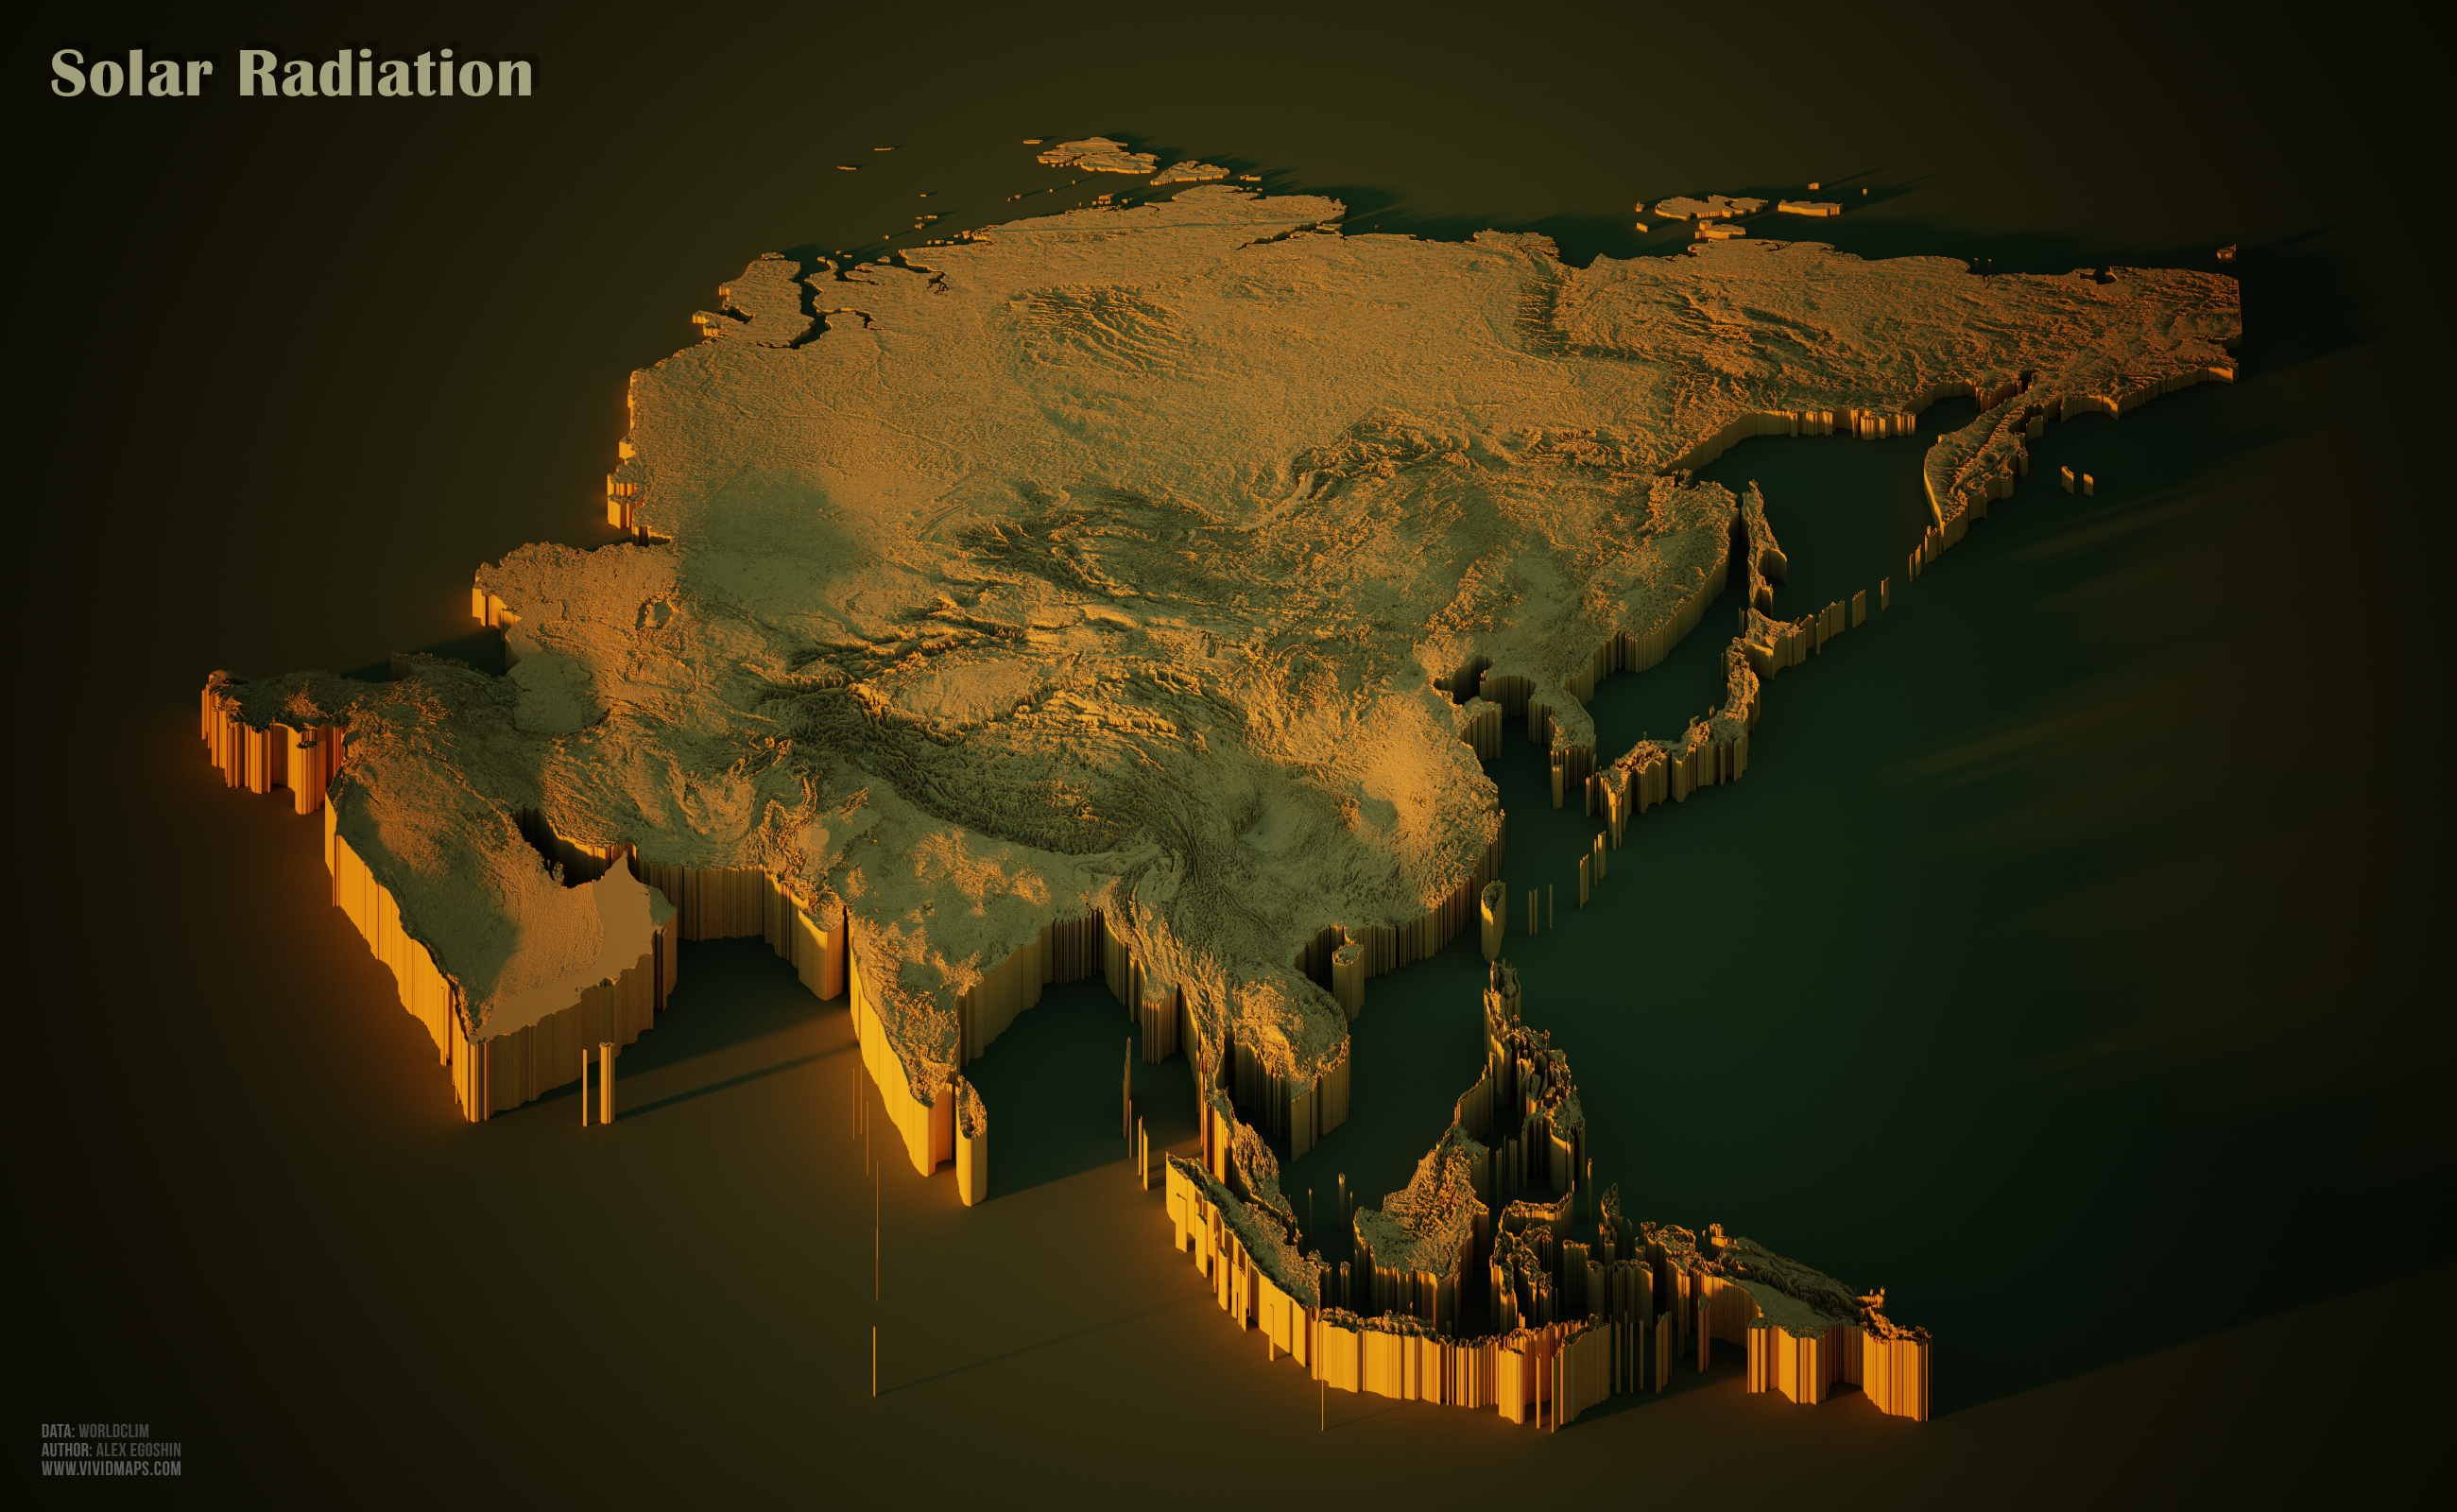
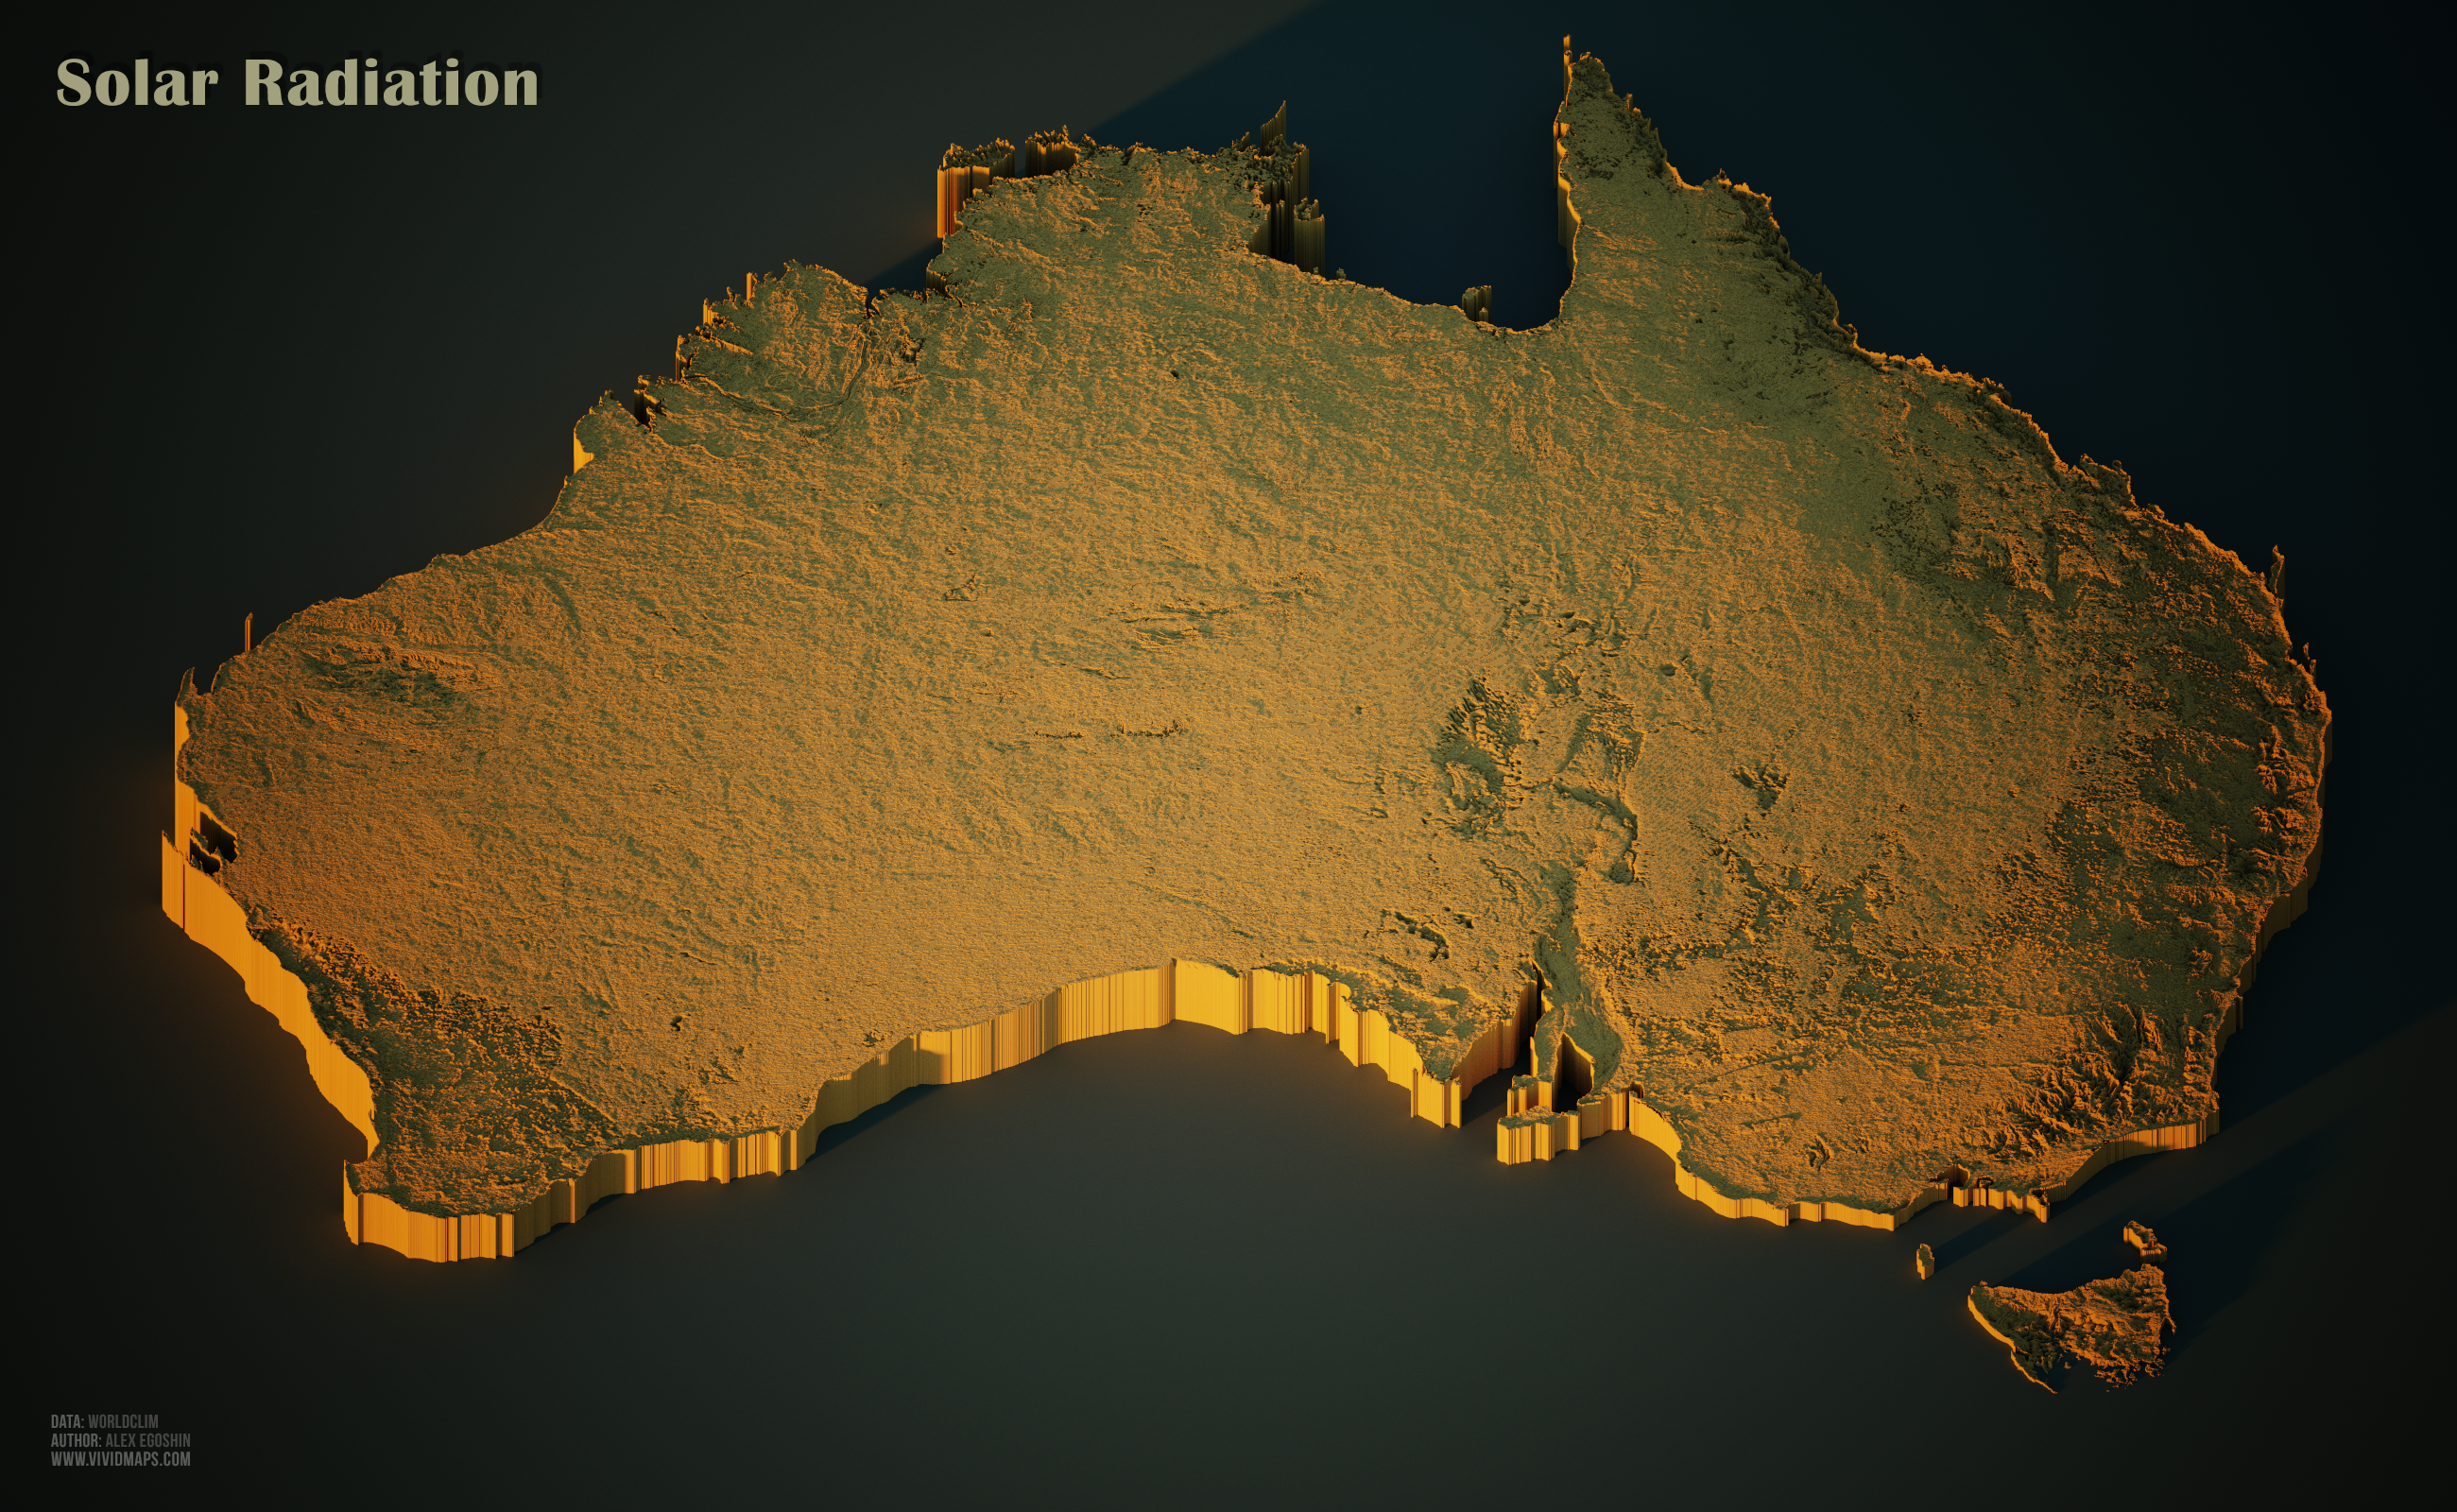
Solar Radiation
The latitude of the location determines how much solar radiation is received. Latitude influences the angle of incidence and duration of daylength.
North America
South America
Europe
Africa
Asia
Australia
Wind Speed
The strongest winds are in the mid-latitudes, where cold polar air masses reach warm air from the tropics. Near the average latitude of the subtropics, winds are lighter.


?")


I wonder how to make the map grid, thank you!
Came to see Wellington’s wind level map and felt super disappointed to see New Zealand excluded from every enlarged map (again) :/
Sorry. Special for you. )
