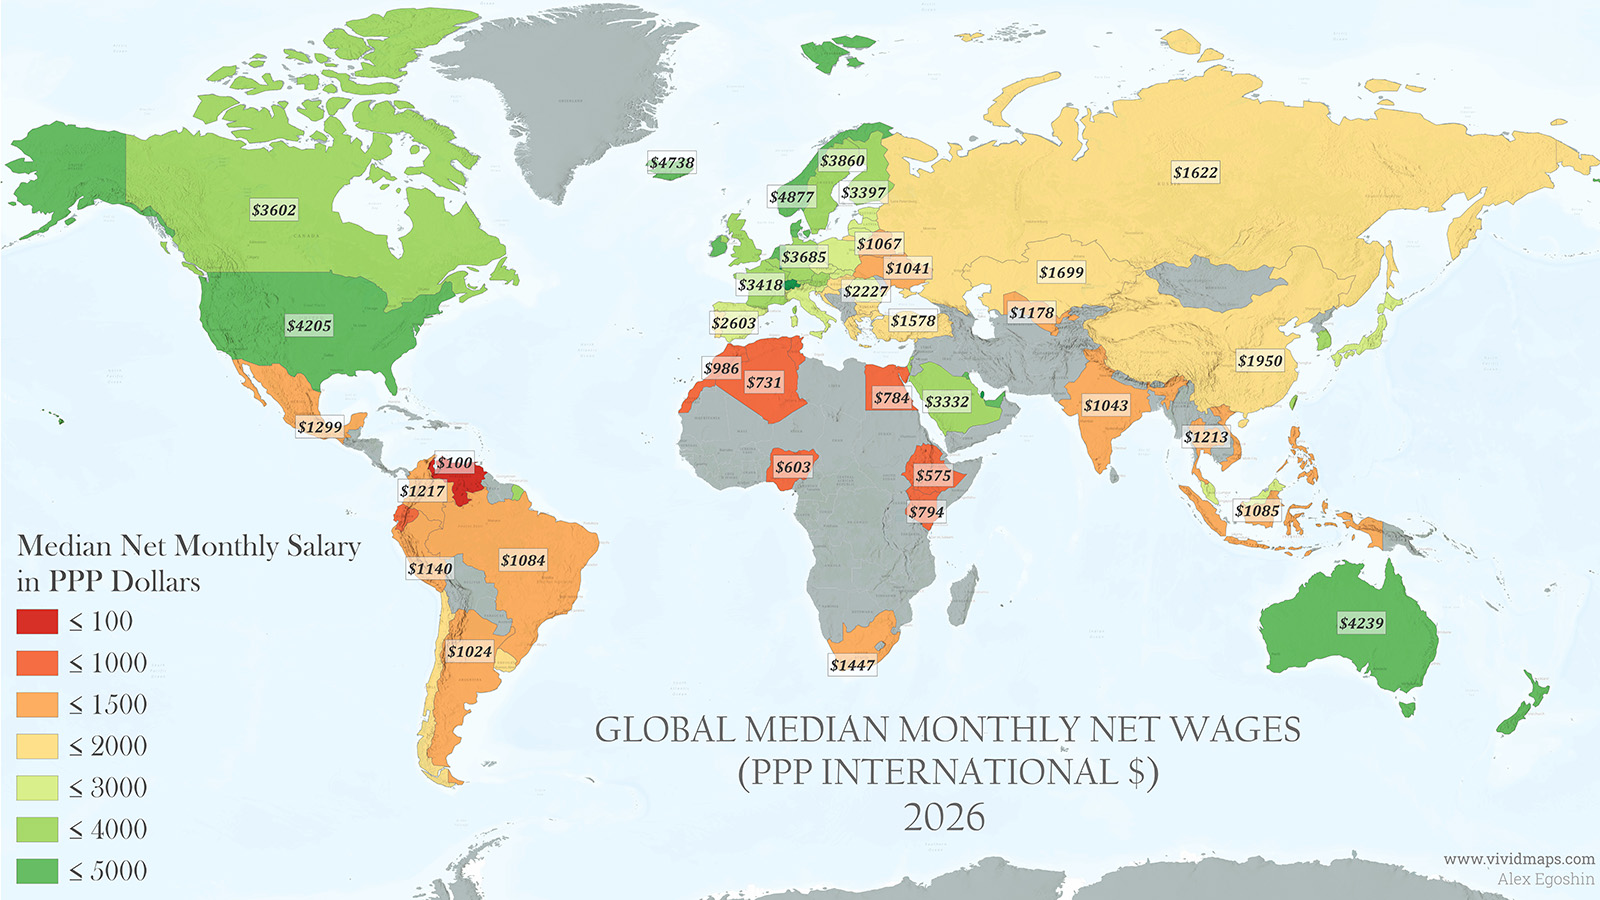
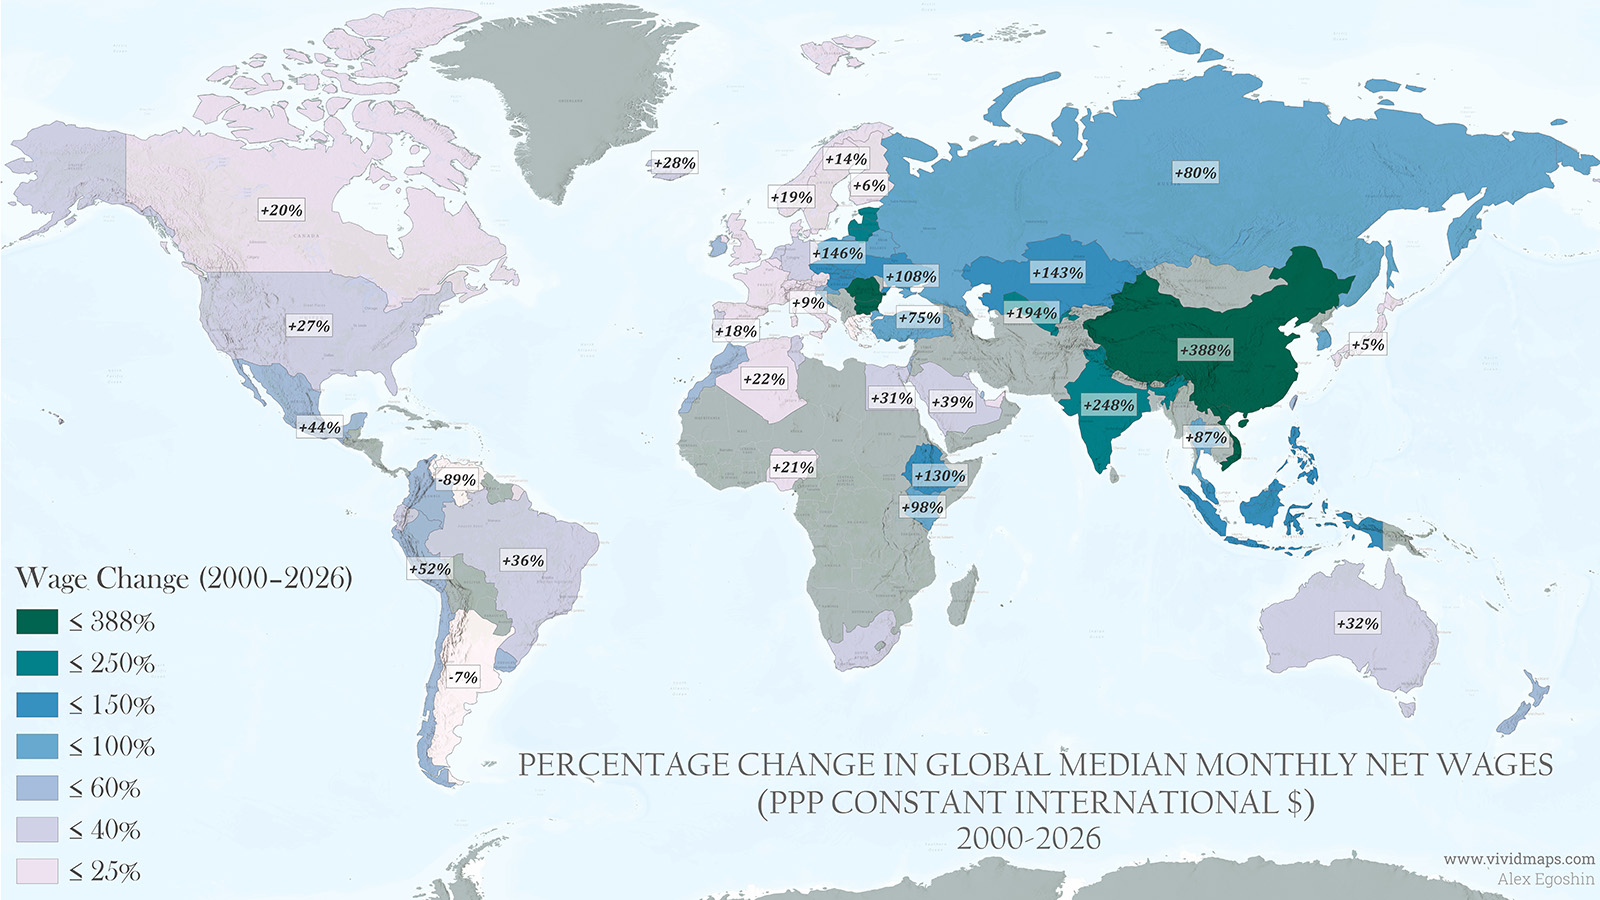
Qatar posted the highest median monthly wage for 2026, $6,312 in PPP-adjusted dollars, with Switzerland and Luxembourg close behind. Venezuela ranked lowest of the 71 countries tracked, at just $100 a month, the only one where pay lost ground since 2000. The typical increase across the other 70 countries was about 45 percent, led by China’s median wage climbing nearly fivefold.
A dollar earned in Caracas and a dollar earned in Zurich buy very different amounts of bread. PPP adjustment tries to correct for that, pricing wages in a common unit instead of a raw currency exchange rate. Once that adjustment is made, the same handful of countries tend to show up at the top of global pay comparisons year after year, mostly Western Europe and the Gulf states.
Which Countries Have the Highest Median Wages in 2026?
Qatar leads the group. Switzerland and Luxembourg follow, both still above $5,300 a month. The United States ranks 11th of 71, at $4,205, up 27.4 percent since 2000. At the other end, Venezuela’s $100 median is less than a sixth of the next-lowest country on the list.
Rank
Country
2026 Median Wage (PPP $)
Change Since 2000
1
Qatar
$6,312
+40.3%
2
Switzerland
$5,633
+17.4%
3
Luxembourg
$5,358
+16.5%
4
Ireland
$4,885
+52.7%
5
Norway
$4,877
+19.0%
6
Iceland
$4,738
+28.1%
7
United Arab Emirates
$4,631
+21.9%
8
Denmark
$4,477
+14.8%
9
Netherlands
$4,309
+34.7%
10
Australia
$4,239
+32.5%
11
United States
$4,205
+27.4%
12
New Zealand
$4,198
+44.8%
13
Kuwait
$4,153
+29.8%
14
Israel
$3,949
+58.0%
15
Sweden
$3,860
+13.5%
16
Austria
$3,723
+24.1%
17
Germany
$3,685
+27.1%
18
United Kingdom
$3,654
+17.9%
19
Canada
$3,602
+20.1%
20
Taiwan
$3,450
+56.8%
21
Belgium
$3,435
+18.4%
22
France
$3,418
+22.1%
23
Finland
$3,397
+6.2%
24
Saudi Arabia
$3,332
+38.8%
25
South Korea
$3,216
+78.7%
26
Japan
$2,928
+4.6%
27
Estonia
$2,690
+198.9%
28
Lithuania
$2,677
+234.6%
29
Czech Republic
$2,608
+117.3%
30
Italy
$2,607
+8.6%
31
Spain
$2,603
+18.3%
32
Slovenia
$2,553
+59.6%
33
Poland
$2,460
+146.0%
34
Malaysia
$2,244
+104.0%
35
Romania
$2,227
+271.2%
36
Latvia
$2,200
+175.0%
37
Slovakia
$2,023
+112.9%
38
Portugal
$1,988
+32.5%
39
China
$1,950
+387.5%
40
Bulgaria
$1,910
+282.0%
41
Chile
$1,907
+58.9%
42
Croatia
$1,892
+72.0%
43
Hungary
$1,849
+105.4%
44
Kazakhstan
$1,699
+142.7%
45
Uruguay
$1,698
+54.4%
46
Greece
$1,669
-7.3%
47
Russia
$1,622
+80.2%
48
Turkey
$1,578
+75.3%
49
South Africa
$1,447
+31.5%
50
Vietnam
$1,439
+311.1%
51
Mexico
$1,299
+44.3%
52
Colombia
$1,217
+52.1%
53
Thailand
$1,213
+86.6%
54
Uzbekistan
$1,178
+194.5%
55
Philippines
$1,159
+131.8%
56
Peru
$1,140
+52.0%
57
Indonesia
$1,085
+141.1%
58
Brazil
$1,084
+35.5%
59
Belarus
$1,067
+77.8%
60
India
$1,043
+247.7%
61
Ukraine
$1,041
+108.2%
62
Argentina
$1,024
-6.9%
63
Morocco
$986
+51.7%
64
Ecuador
$935
+33.6%
65
Kenya
$794
+98.5%
66
Egypt
$784
+30.7%
67
Algeria
$731
+21.8%
68
Tunisia
$698
+26.9%
69
Nigeria
$603
+20.6%
70
Ethiopia
$575
+130.0%
71
Venezuela
$100
-88.9%
How Have Wages Changed Since 2000?
Qatar leads on pay level, but its 26-year growth rate, 40.3 percent, is modest next to countries catching up from a much lower base. China’s median wage grew from $400 to $1,950, up 387.5 percent, the largest increase in the group. Vietnam and Bulgaria weren’t far behind, up 311 and 282 percent.
Only three countries in the dataset paid less in 2026 than in 2000. Venezuela’s drop was the steepest by far, down 88.9 percent. Argentina and Greece also slipped, both by less than 10 percent.