Every man carries a Y chromosome copied almost unchanged from his father, who received it from his own father. Small mutations collect along that line, and geneticists group them into haplogroups, the main branches of one enormous paternal family tree. Plot where each branch dominates and ancient migrations start to appear on the map.
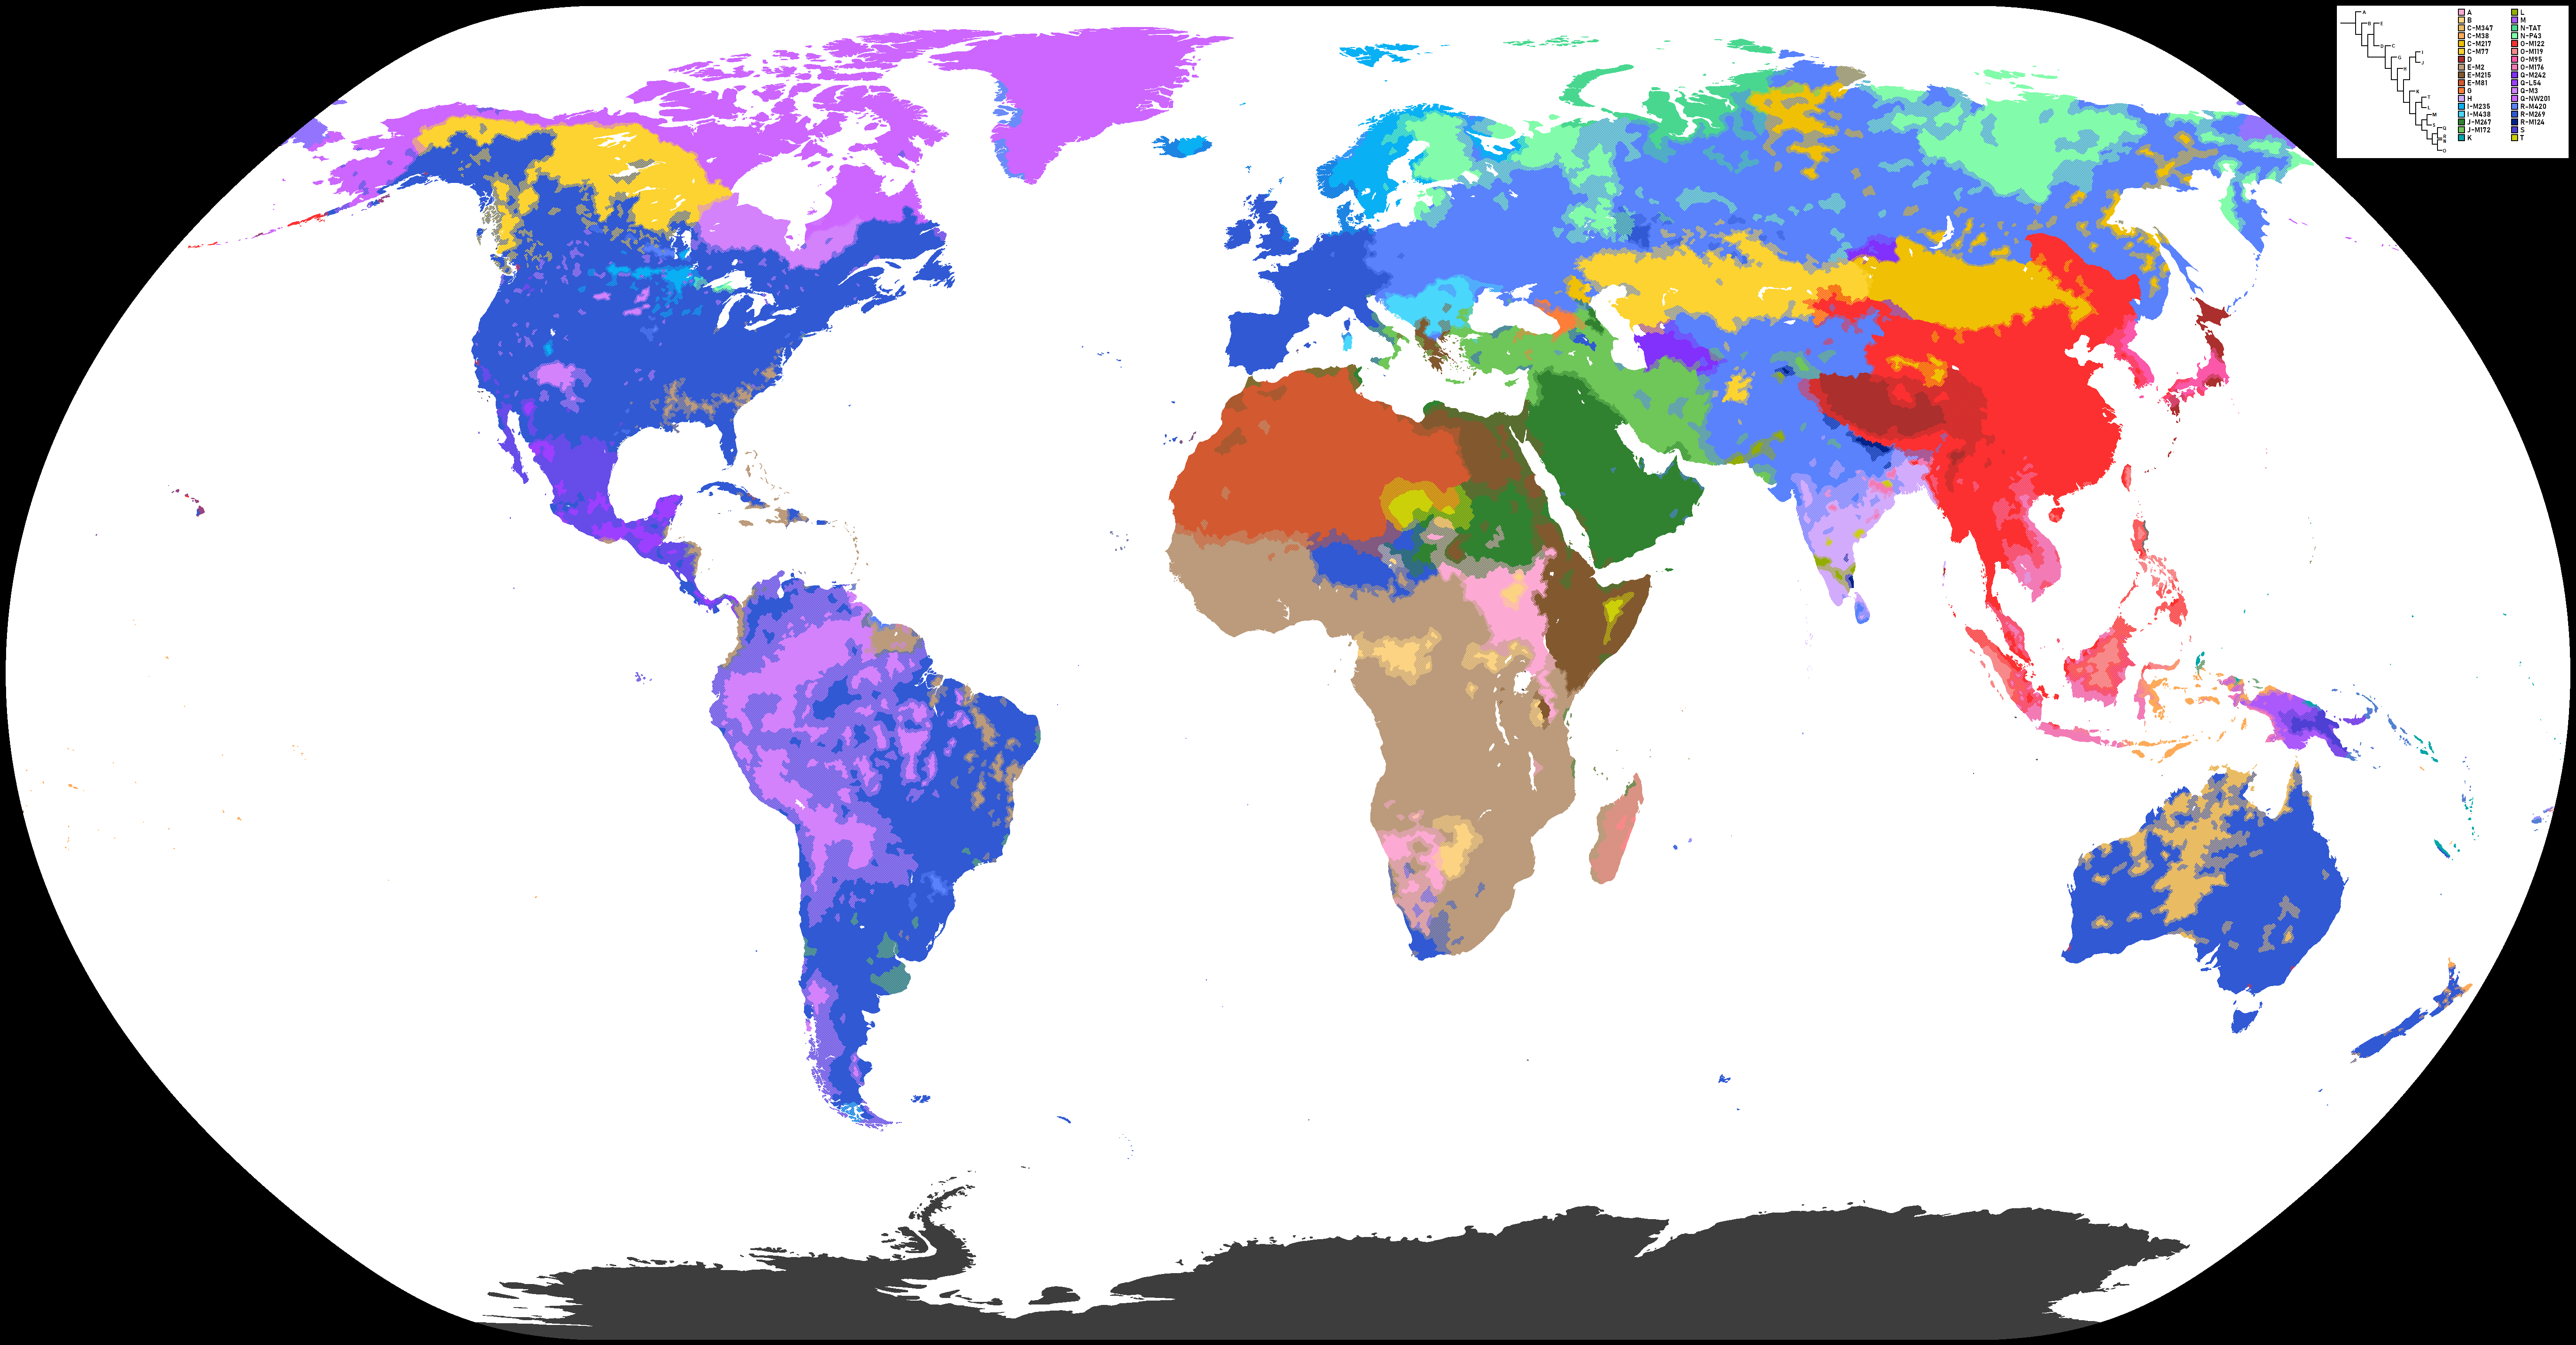
Y-DNA haplogroups are branches of the human paternal family tree, and each one clusters in a recognizable part of the world. R1b dominates Western Europe, R1a stretches from Poland to Central Asia, O is the main lineage of East and Southeast Asia, E-M2 leads across much of sub-Saharan Africa, and Q links Siberia to the Americas.
Last updated October 29, 2026
Key Takeaways
Y-DNA follows one line only, father to son, so it describes a thin slice of anyone’s ancestry.
The most recent common ancestor of all living men’s Y chromosomes lived roughly 200,000 to 300,000 years ago.
The R-M269 lineage climbs from 22.7% in a Polish survey to 92.3% in a Welsh one.
Q reaches 92.3% among the Navajo and 90 to 94% among the Kets of Siberia.
What is a Y-DNA haplogroup, and how old are the oldest ones?
A haplogroup is a large branch of the Y-chromosome tree, defined by mutations its members share. Names such as R1b or Q are shorthand for those branches, and tags such as M242 or M269 name the specific mutation marking each one.
The trunk of that tree is deep. The most recent common ancestor of all living men’s Y chromosomes is currently placed around 200,000 to 300,000 years ago. A 2015 study gave a 95% interval of 192,000 to 307,000 years. Estimates from the year 2000 were far younger, near 59,000 years, and the figure climbed once sequencing improved and a very divergent lineage called A00 was announced in 2013.
Which haplogroup dominates each region?
The table follows the map from Africa eastward to the Americas. Each row is one published survey, so it works as a set of reference points and not as a complete ranking.
Region
Population / Ethnos
Haplogroup (SNP)
Share of Men (%)
West and Central Africa
Bamileke (Cameroon)
E1b1a (E-M2)
96.0% – 100.0%
Southern Africa
Khoisan
A (A-M51)
44.3%
Western Europe
Welsh (Wales)
R1b (R-M269)
92.3%
Central Europe
Poles
R1b (R-M269)
22.7%
Northern Europe
Finns
N1a1 (N-M46)
64.0%
Central Asia
Kyrgyz (Central Kyrgyzstan)
R1a (R-M417)
63.5%
Northern Asia
Kets (Siberia)
Q (Q-M242)
90.0% – 94.0%
Eastern Asia
Tibetans
D1a1 (D-M174)
41.3%
Eastern Asia
Japanese
D1a1 (D-M174)
35.1%
North America
Navajo
Q (Q-M242)
92.3%
Why does R1b fade so sharply from west to east?
R1a is most frequent in eastern Europe and R1b in the west. The Welsh and Polish rows show how steep the drop is for R-M269, the dominant branch of R1b.
The explanation has changed. Older work linked R1b to Neolithic farmers moving out of the Near East. Ancient DNA has since tied R-M269 subclades to steppe ancestry arriving in western Europe after 2500 BC, and a 2022 study called a North Caucasus and steppe origin the most likely hypothesis. Early European farmers mostly carried haplogroup G2a, not R1b.
How did Q travel from Siberia to the Americas?
Haplogroup Q probably arose in Central Asia or southern Siberia some 15,000 to 25,000 years ago, and it peaks among the Kets and Selkups of Siberia. Its branch Q-M3 is found only in Native Americans and is about 15,000 years old.
Ancient genomes support the link. Two American-specific branches, Q-Z780 and Q-M3, mark the remains of Anzick-1 and Kennewick.
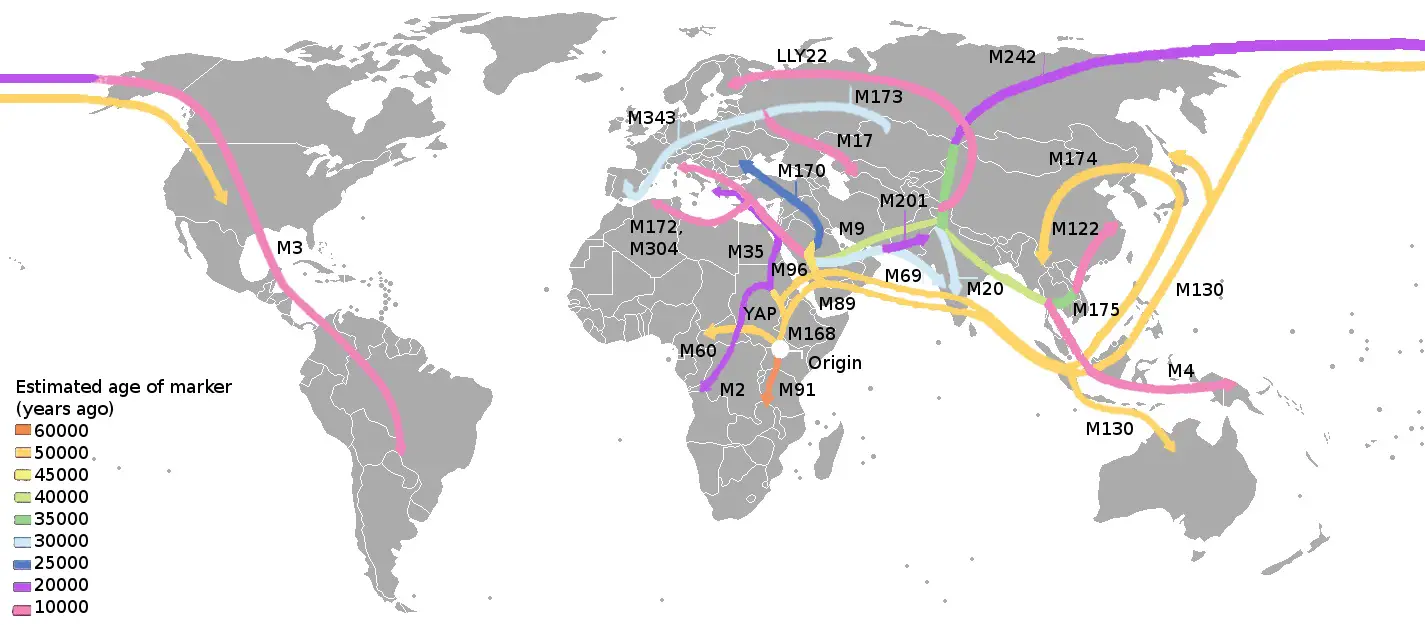
Y-DNA Migration Map
The second map traces proposed migration paths marker by marker, and it closely resembles the early human migration map associated with Spencer Wells and National Geographic’s Genographic Project. The M-numbers are mutations, not peoples. M173 defines haplogroup R1, M242 defines Q and M122 belongs to O. M3 is now classified inside Q as Q-M3.
Treat the ages in the legend as estimates from earlier marker studies. The common ancestor of all Y lineages has already moved from about 59,000 years to the 200,000 to 300,000 range, and routes drawn as single arrows compress many overlapping movements.
Below is a more detailed, modern haplogroup map of the world according to recent advancements in genetic sequencing technology.
FAQ
What does a Y-DNA haplogroup show? It shows which branch of the paternal family tree a man belongs to. Because the Y chromosome passes from father to son, the result follows one line of ancestry and says nothing directly about the rest of a person’s family.
Which Y-DNA haplogroup is most common in Europe? R1b, mostly its R-M269 branch, is the most common European lineage and reaches 92.3% in a Welsh survey. R1a is more frequent in the east.
Which haplogroup do Native Americans carry? Mostly Q, through its Q-M3 and Q-Z780 branches. The Navajo reach 92.3%.
Can a DNA test kit identify my Y-DNA haplogroup? Only a Y-chromosome test can, and women can ask a father, brother or paternal uncle to take one.