Living Past 65: How Life Expectancy Differs for Men and Women Around the World
This post may contain affiliate links. As an Amazon Associate, we earn from qualifying purchases.
Remember your grandparents telling stories about “back in their day”? Well, here’s a story that would surprise even them. In 1900, reaching age 65 was like winning a lottery – only one in four Americans made it that far. Today, the script has flipped completely – more than 70% of us will celebrate our 65th birthday and many more after that.
I’ve created these maps to show you something fascinating about our world today. The colors tell the story at a glance – green shows countries where more people live past 65, while red reveals places where fewer people reach this milestone.
Men’s Story
Let’s look at our first map:

The patterns here might surprise you. Notice how North America and Western Europe glow green, while parts of Africa and the former Soviet Union show redder shades. Each color represents countless life stories, and the differences between regions are striking.
Want to see something even more interesting? Watch how these patterns have changed:

Over these 55 years, most countries have grown steadily greener – that’s millions more people living longer lives. But not everywhere. Some parts of Africa still struggle with shorter lifespans, often due to limited healthcare access.
Percentage of the male population dying before the age of 65
Rank | Country | Percentage of the male population dying before the age of 65 |
---|---|---|
1 | Lesotho | 67 |
2 | Swaziland | 62 |
3 | Central African Republic | 60 |
4 | Sierra Leone | 59 |
5 | Cote d’Ivoire | 58 |
6 | Chad | 56 |
7 | Nigeria | 55 |
8 | South Africa | 54 |
9 | Mozambique | 52 |
10 | Zimbabwe | 51 |
11 | Somalia | 51 |
12 | Burundi | 50 |
13 | Equatorial Guinea | 50 |
14 | Cameroon | 50 |
15 | South Sudan | 50 |
16 | Guinea-Bissau | 49 |
17 | Uganda | 49 |
18 | Zambia | 48 |
19 | Malawi | 47 |
20 | Namibia | 47 |
21 | Mali | 46 |
22 | Angola | 45 |
23 | Togo | 45 |
24 | Democratic Republic of the Congo | 45 |
25 | Niger | 44 |
26 | Burkina Faso | 44 |
27 | Guinea | 44 |
28 | Gambia | 44 |
29 | Benin | 43 |
30 | Eritrea | 43 |
31 | Russian Federation | 43 |
32 | Botswana | 42 |
33 | Kazakhstan | 42 |
34 | Mongolia | 42 |
35 | Haiti | 42 |
36 | Djibouti | 42 |
37 | Comoros | 41 |
38 | Ghana | 41 |
39 | Liberia | 41 |
40 | Papua New Guinea | 41 |
41 | Belarus | 40 |
42 | Ukraine | 40 |
43 | Turkmenistan | 40 |
44 | Afghanistan | 40 |
45 | Republic Congo | 40 |
46 | Philippines | 39 |
47 | Mauritania | 39 |
48 | Yemen | 39 |
49 | Sudan | 39 |
50 | Kiribati | 39 |
51 | Tanzania | 39 |
52 | Kenya | 38 |
53 | Guyana | 38 |
54 | Ethiopia | 38 |
55 | Myanmar | 37 |
56 | Moldova | 37 |
57 | Gabon | 37 |
58 | Madagascar | 37 |
59 | Lao PDR | 36 |
60 | Lithuania | 36 |
61 | Syrian Arab Republic | 36 |
62 | Rwanda | 36 |
63 | Kyrgyz Republic | 36 |
64 | Sao Tome and Principe | 35 |
65 | Senegal | 35 |
66 | Fiji | 35 |
67 | India | 34 |
68 | El Salvador | 34 |
69 | Latvia | 34 |
70 | Bolivia | 34 |
71 | Seychelles | 34 |
72 | Pakistan | 33 |
73 | Georgia | 33 |
74 | Suriname | 33 |
75 | Belize | 33 |
76 | Indonesia | 33 |
77 | Cambodia | 33 |
78 | Trinidad and Tobago | 33 |
79 | Iraq | 32 |
80 | Early-demographic dividend | 32 |
81 | Bhutan | 31 |
82 | Timor-Leste | 31 |
83 | Uzbekistan | 31 |
84 | Guatemala | 30 |
85 | Tajikistan | 30 |
86 | Egypt | 30 |
87 | Micronesia | 30 |
88 | North Korea | 30 |
89 | Bulgaria | 29 |
90 | Azerbaijan | 29 |
91 | Nepal | 29 |
92 | Dominican Republic | 29 |
93 | Thailand | 28 |
94 | Grenada | 28 |
95 | Libya | 28 |
96 | Venezuela | 28 |
97 | Solomon Islands | 28 |
98 | Armenia | 28 |
99 | Romania | 28 |
100 | Caribbean small states | 28 |
101 | Middle income | 28 |
102 | Mauritius | 28 |
103 | Hungary | 28 |
104 | Tonga | 28 |
105 | Estonia | 27 |
106 | Honduras | 27 |
107 | Bahamas | 27 |
108 | Nicaragua | 27 |
109 | Colombia | 27 |
110 | Vietnam | 27 |
111 | Sri Lanka | 27 |
112 | Brazil | 27 |
113 | Bangladesh | 27 |
114 | St. Lucia | 26 |
115 | St. Vincent and the Grenadines | 26 |
116 | Paraguay | 26 |
117 | Vanuatu | 26 |
118 | Samoa | 25 |
119 | Poland | 25 |
120 | Cabo Verde | 25 |
121 | Malaysia | 24 |
122 | Argentina | 24 |
123 | Serbia | 24 |
124 | Peru | 24 |
125 | Slovak Republic | 24 |
126 | Jamaica | 23 |
127 | Ecuador | 23 |
128 | West Bank and Gaza | 23 |
129 | Uruguay | 22 |
130 | Turkey | 22 |
131 | Jordan | 22 |
132 | Mexico | 22 |
133 | Antigua and Barbuda | 22 |
134 | Panama | 22 |
135 | Bosnia and Herzegovina | 21 |
136 | Barbados | 21 |
137 | Croatia | 21 |
138 | Macedonia | 21 |
139 | Puerto Rico | 20 |
140 | Tunisia | 20 |
141 | Aruba | 20 |
142 | Curacao | 20 |
143 | Montenegro | 20 |
144 | French Polynesia | 20 |
145 | United States | 19 |
146 | Algeria | 19 |
147 | Czech Republic | 19 |
148 | Saudi Arabia | 19 |
149 | Oman | 18 |
150 | New Caledonia | 18 |
151 | Brunei Darussalam | 17 |
152 | China | 17 |
153 | Cuba | 17 |
154 | Costa Rica | 17 |
155 | Chile | 17 |
156 | Finland | 16 |
157 | Slovenia | 16 |
158 | United Arab Emirates | 16 |
159 | Kuwait | 16 |
160 | Iran | 16 |
161 | Germany | 15 |
162 | Albania | 15 |
163 | Morocco | 15 |
164 | the Maldives | 15 |
165 | France | 15 |
166 | Portugal | 15 |
167 | Virgin Islands (U.S.) | 14 |
168 | Guam | 14 |
169 | Austria | 14 |
170 | Denmark | 14 |
171 | Bahrain | 14 |
172 | Greece | 14 |
173 | Belgium | 14 |
174 | United Kingdom | 13 |
175 | Lebanon | 13 |
176 | Luxembourg | 13 |
177 | Qatar | 13 |
178 | South Korea | 13 |
179 | New Zealand | 12 |
180 | Japan | 12 |
181 | Ireland | 12 |
182 | Cyprus | 12 |
183 | Canada | 12 |
184 | Spain | 12 |
185 | Sweden | 11 |
186 | Singapore | 11 |
187 | Australia | 11 |
188 | Hong Kong SAR | 11 |
189 | Channel Islands | 11 |
190 | Italy | 11 |
191 | Netherlands | 11 |
192 | Israel | 11 |
193 | Malta | 11 |
194 | Norway | 11 |
195 | Iceland | 10 |
196 | Macao SAR | 10 |
197 | Switzerland | 10 |
Women’s Journey
Now, here’s the same map for women:

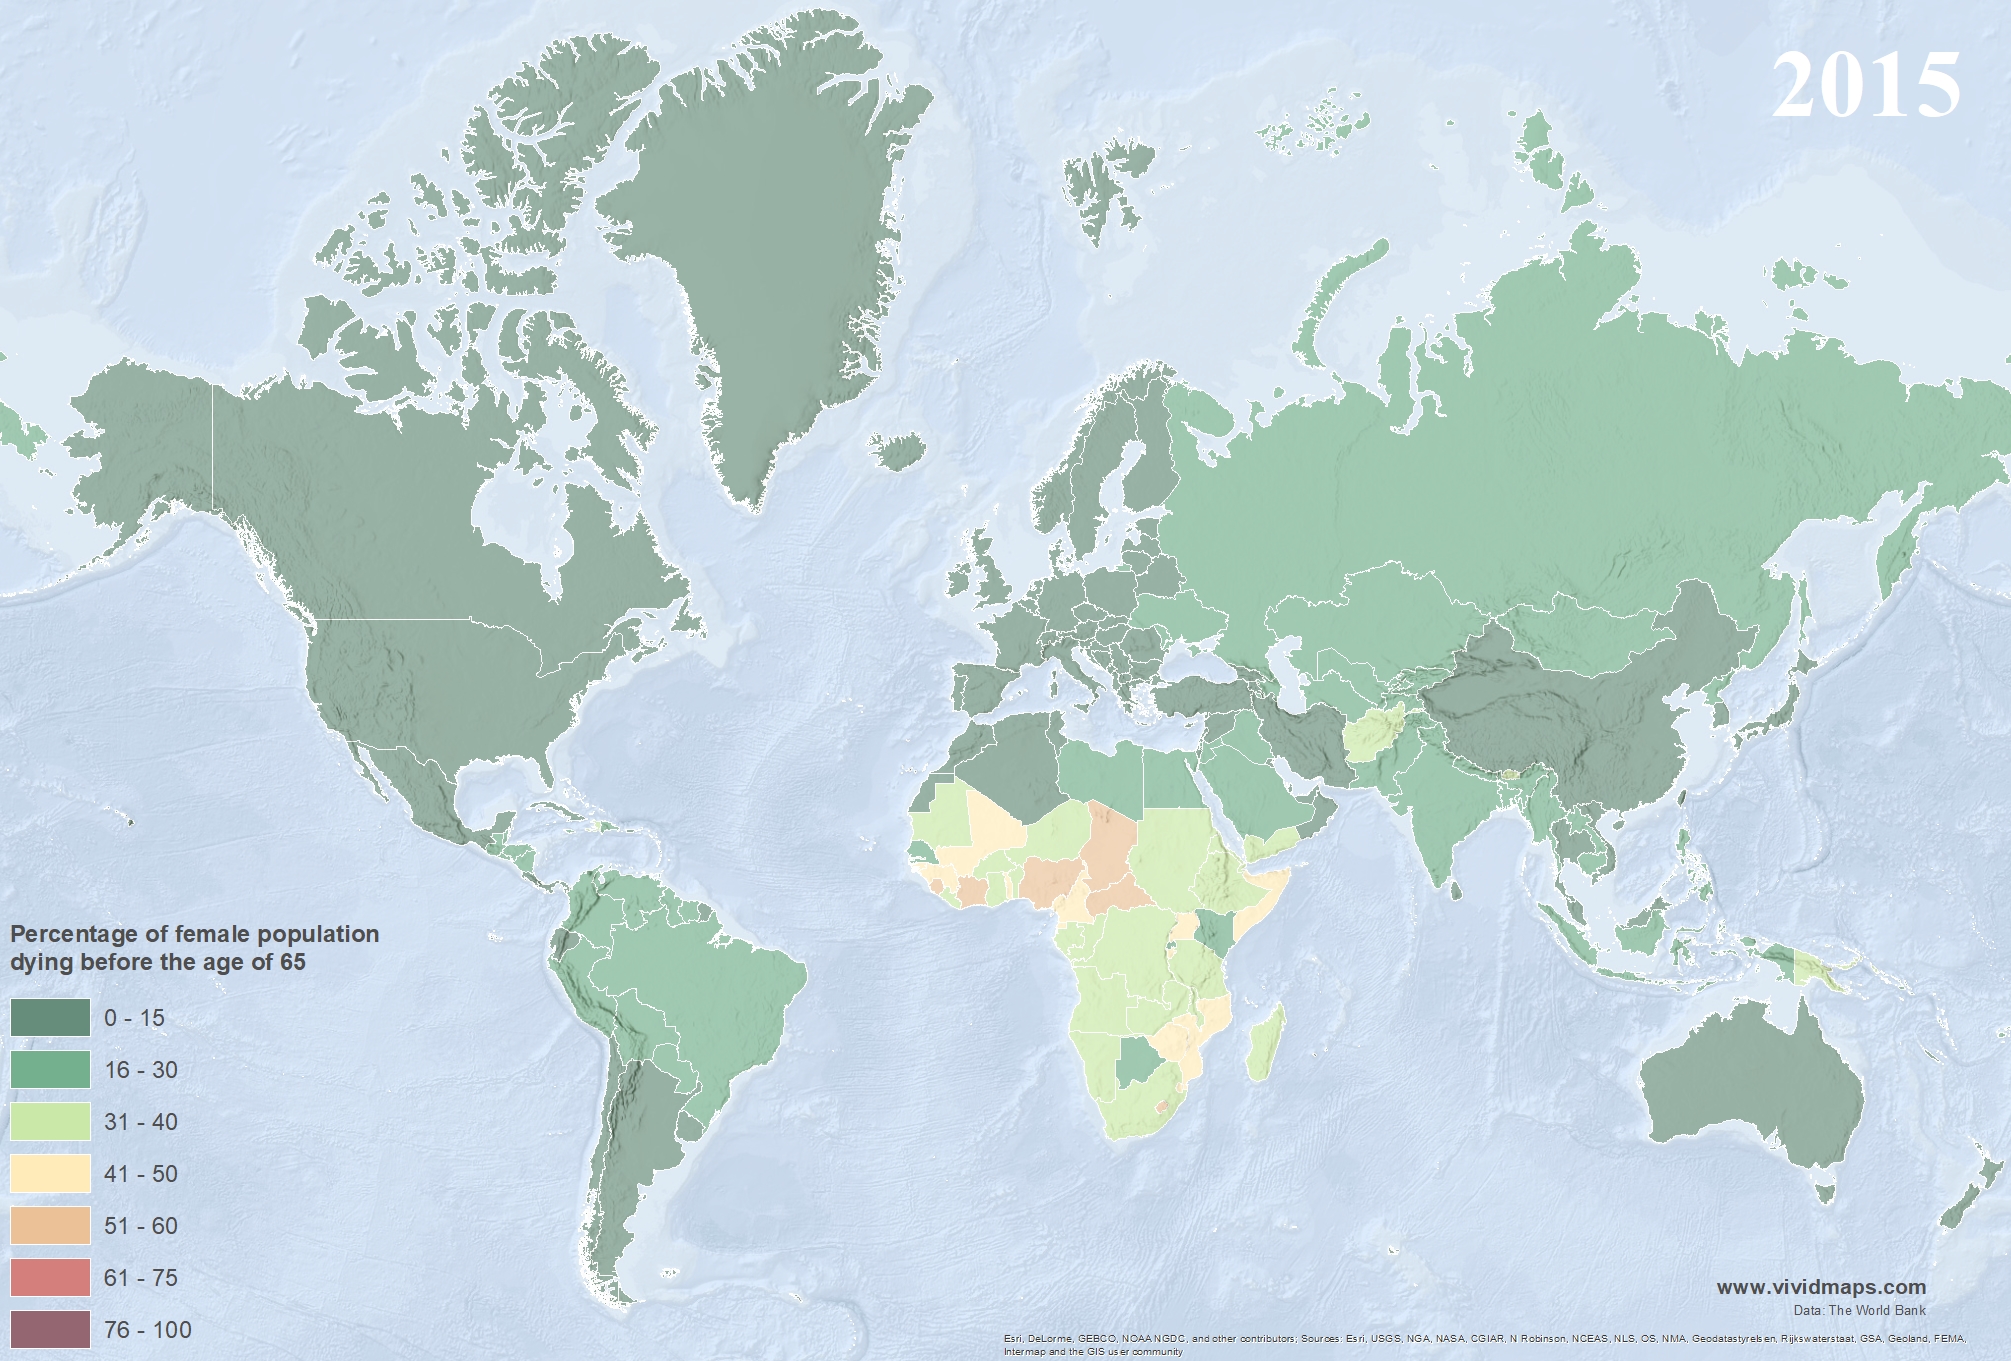
Notice something? There’s a lot more green here. In fact, the global numbers tell us that while 27% of men don’t reach 65, for women it’s only 19%. That’s not just statistics – it’s millions of extra birthdays, anniversaries, and moments with loved ones.
Let’s watch how this changed over time:

The transformation is remarkable. Take South Korea, for instance – they’ve gone from mostly red to bright green in just a few decades. How? By dramatically improving healthcare and education.
Percentage of the female population dying before the age of 65
Rank | Country | Percentage of female population dying before the age of 65 |
---|---|---|
1 | Lesotho | 57 |
2 | Sierra Leone | 57 |
3 | Central African Republic | 55 |
4 | Côte d'Ivoire | 53 |
5 | Nigeria | 51 |
6 | Chad | 51 |
7 | South Sudan | 47 |
8 | Cameroon | 46 |
9 | Swaziland | 46 |
10 | Somalia | 45 |
11 | Equatorial Guinea | 45 |
12 | Zimbabwe | 44 |
13 | Mali | 43 |
14 | Mozambique | 43 |
15 | Burundi | 42 |
16 | Guinea-Bissau | 41 |
17 | Togo | 40 |
18 | Uganda | 40 |
19 | Guinea | 40 |
20 | Niger | 39 |
21 | Dem Rep Congo | 39 |
22 | Burkina Faso | 39 |
23 | South Africa | 38 |
24 | Benin | 37 |
25 | Gambia | 37 |
26 | Zambia | 37 |
27 | Ghana | 36 |
28 | Liberia | 36 |
29 | Djibouti | 36 |
30 | Malawi | 35 |
31 | Angola | 35 |
32 | Rep Congo | 35 |
33 | Namibia | 35 |
34 | Eritrea | 34 |
35 | Haiti | 34 |
36 | Afghanistan | 34 |
37 | Comoros | 33 |
38 | Papua New Guinea | 32 |
39 | Tanzania | 32 |
40 | Gabon | 32 |
41 | Mauritania | 32 |
42 | Sudan | 32 |
43 | Yemen | 32 |
44 | Ethiopia | 31 |
45 | Bhutan | 31 |
46 | Madagascar | 30 |
47 | Lao PDR | 29 |
48 | Pakistan | 28 |
49 | Rwanda | 28 |
50 | Kenya | 28 |
51 | Botswana | 28 |
52 | Guyana | 28 |
53 | Bolivia | 27 |
54 | Sao Tome and Principe | 27 |
55 | Myanmar | 27 |
56 | India | 26 |
57 | Small states | 26 |
58 | Senegal | 26 |
59 | Kiribati | 26 |
60 | Micronesia | 25 |
61 | Indonesia | 24 |
62 | Cambodia | 24 |
63 | Turkmenistan | 24 |
64 | Nepal | 23 |
65 | Timor-Leste | 23 |
66 | Mongolia | 22 |
67 | Solomon Islands | 22 |
68 | Iraq | 22 |
69 | Fiji | 22 |
70 | Philippines | 22 |
71 | Tajikistan | 21 |
72 | Trinidad and Tobago | 21 |
73 | Bangladesh | 21 |
74 | St. Vincent and the Grenadines | 20 |
75 | Egypt | 20 |
76 | Suriname | 20 |
77 | Paraguay | 20 |
78 | Belize | 20 |
79 | Guatemala | 19 |
80 | Dominican Republic | 19 |
81 | Kazakhstan | 19 |
82 | Uzbekistan | 19 |
83 | Honduras | 19 |
84 | Cabo Verde | 18 |
85 | Moldova | 18 |
86 | Tonga | 18 |
87 | Russian Federation | 18 |
88 | Vanuatu | 18 |
89 | Kyrgyz Republic | 18 |
90 | North Korea | 18 |
91 | Caribbean small states | 18 |
92 | The Bahamas | 17 |
93 | Azerbaijan | 17 |
94 | St. Lucia | 17 |
95 | Libya | 17 |
96 | Nicaragua | 17 |
97 | Jordan | 16 |
98 | Peru | 16 |
99 | Grenada | 16 |
100 | El Salvador | 16 |
101 | West Bank and Gaza | 16 |
102 | Ukraine | 16 |
103 | Venezuela | 15 |
104 | Belarus | 15 |
105 | Ecuador | 15 |
106 | Samoa | 15 |
107 | Algeria | 15 |
108 | Saudi Arabia | 15 |
109 | Antigua and Barbuda | 15 |
110 | Mauritius | 15 |
111 | Brazil | 15 |
112 | Jamaica | 15 |
113 | Colombia | 15 |
114 | Latvia | 14 |
115 | Armenia | 14 |
116 | Hungary | 14 |
117 | Syrian Arab Republic | 14 |
118 | Seychelles | 14 |
119 | Malaysia | 14 |
120 | Mexico | 14 |
121 | Thailand | 14 |
122 | Argentina | 13 |
123 | Morocco | 13 |
124 | Oman | 13 |
125 | French Polynesia | 13 |
126 | Tunisia | 13 |
127 | Uruguay | 13 |
128 | Romania | 13 |
129 | Panama | 13 |
130 | Serbia | 13 |
131 | Georgia | 13 |
132 | Bulgaria | 13 |
133 | Lithuania | 13 |
134 | Cuba | 12 |
135 | United States | 12 |
136 | Macedonia | 12 |
137 | Iran | 12 |
138 | Kuwait | 12 |
139 | Brunei Darussalam | 12 |
140 | Turkey | 12 |
141 | Vietnam | 12 |
142 | Sri Lanka | 12 |
143 | Barbados | 12 |
144 | Aruba | 12 |
145 | China | 12 |
146 | United Arab Emirates | 12 |
147 | Slovak Republic | 11 |
148 | Poland | 11 |
149 | Montenegro | 11 |
150 | Curacao | 11 |
151 | Qatar | 11 |
152 | Chile | 11 |
153 | Bosnia and Herzegovina | 11 |
154 | Bahrain | 11 |
155 | Maldives | 11 |
156 | Costa Rica | 10 |
157 | Estonia | 10 |
158 | New Caledonia | 10 |
159 | Belgium | 9 |
160 | Puerto Rico | 9 |
161 | Lebanon | 9 |
162 | Denmark | 9 |
163 | Czech Republic | 9 |
164 | Croatia | 9 |
165 | Albania | 9 |
166 | Channel Islands | 8 |
167 | France | 8 |
168 | Luxembourg | 8 |
169 | Netherlands | 8 |
170 | Germany | 8 |
171 | Canada | 8 |
172 | New Zealand | 8 |
173 | Virgin Islands (U.S.) | 8 |
174 | Guam | 8 |
175 | United Kingdom | 8 |
176 | Iceland | 7 |
177 | Australia | 7 |
178 | Greece | 7 |
179 | Israel | 7 |
180 | Sweden | 7 |
181 | Portugal | 7 |
182 | Norway | 7 |
183 | Finland | 7 |
184 | Austria | 7 |
185 | Ireland | 7 |
186 | Malta | 7 |
187 | Slovenia | 7 |
188 | Hong Kong | 6 |
189 | South Korea | 6 |
190 | Spain | 6 |
191 | Italy | 6 |
192 | Japan | 6 |
193 | Switzerland | 6 |
194 | Cyprus | 6 |
195 | Singapore | 6 |
196 | Macao SAR | 4 |
Why Do Women Live Longer?
You might be wondering – is it just biology? Actually, it’s more complicated than that. Yes, women have some biological advantages, but lifestyle plays a huge role. Men tend to:
- Put off doctor visits longer
- Work in riskier jobs
- Take more dangerous risks in general
These maps aren’t just pretty colors – they’re a window into how our world is changing. Fifty years ago, reaching 65 was less certain. Today, most of us need to plan for a longer life than our grandparents ever imagined.
What’s the story in your part of the world? Do you see these patterns in your own family? Share your thoughts below – I’d love to hear how these global trends match up with your local experience.