Mapping Displacement and Gentrification in the San Francisco Bay Area
The Bay Area’s booming jobs and housing market necessitates a careful look at the causes and consequences of neighborhood change to protect residents that are most vulnerable to potentially being displaced. Wages for the Bay Area’s low-income residents have not kept pace with the sky-rocketing housing prices resulting in massive demographic shifts in the area.
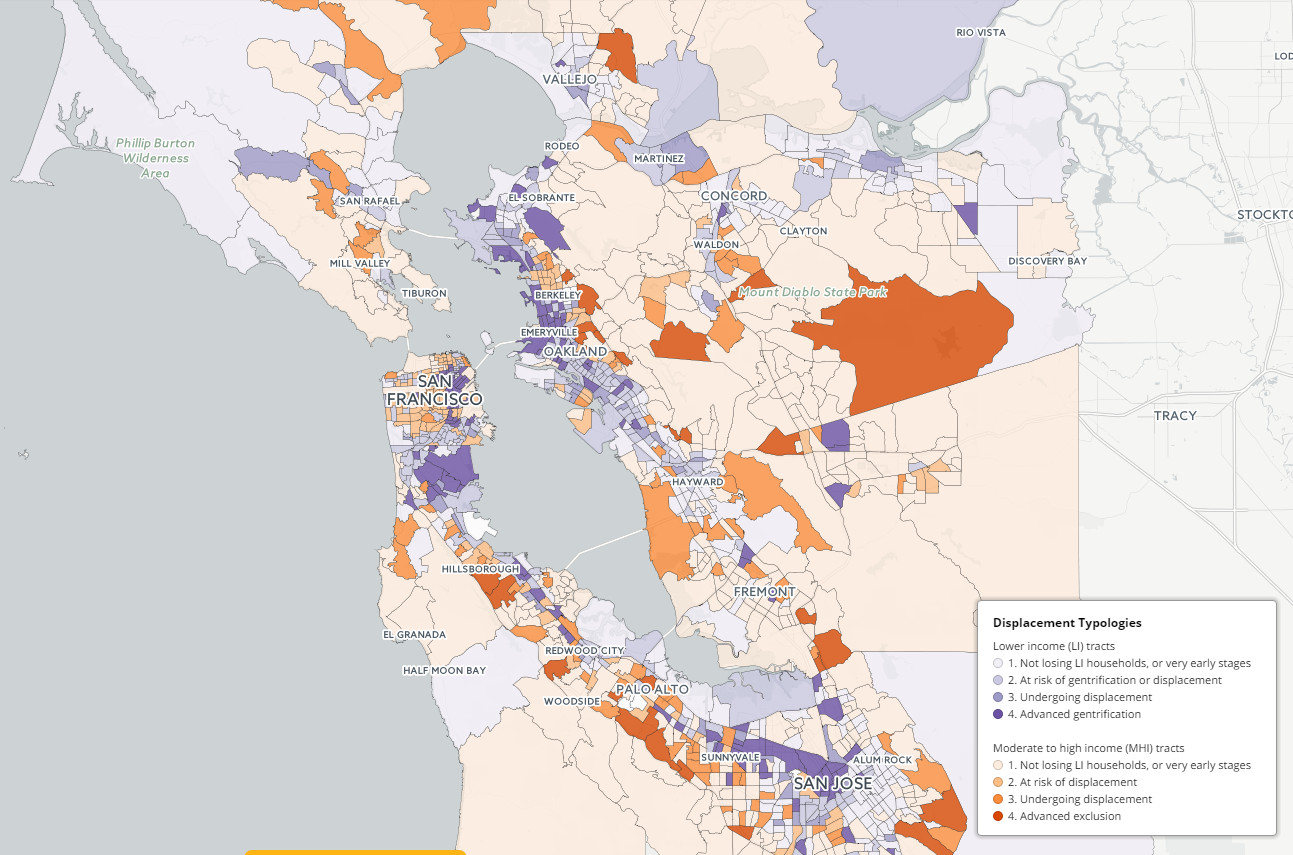
UC Berkeley analyzed regional data on housing, income, and other demographics to better understand and predict where gentrification and displacement are happening and will likely occur in the future. This analysis, which is summarized in the interactive maps, will allow communities to better characterize their experience and risk of displacement and to stimulate action. The analysis of these maps was validated through in-depth case studies of 9 Bay Area communities and with the support and advice of the Regional Prosperity Plan at the Metropolitan Transportation Commission. In developing 8 neighborhood displacement typologies, communities can better understand where they’re at and develop actions to prevent from advancing in the stages of gentrification and displacement.

www.urbandisplacement.org/map
Key Findings
– In 2013, 48 percent of census tracts and more than 53 percent of low-income households lived in neighborhoods at risk of or already experiencing displacement and gentrification pressures.
– Neighborhoods with rail stations, historic housing stock, and rising housing prices are especially at risk of losing low-income households.
– Low-income neighborhoods are not the only ones experiencing displacement pressures – many higher-income neighborhoods that still house low-income households are also rapidly losing low-income population.
– The number of tracts at risk of displacement is 123% higher than the numbers already experiencing them, indicating that the transformation of the Bay Area will continue to accelerate.
Via www.urbandisplacement.org/map


