Marriage in the US: Where the most people are married?
Marriage is a partnership that can legally, financially, and culturally bind two people.
Marriage in the United States has been decreased over the recent past and is currently at historic low levels for the nation.
Throughout the 20th century, the annual U.S. marriage rate was typically no less than 8 marriages per 1,000 people. The marriage rate also altered dramatically over the years of the past century. It dropped at the time of the Great Depression (8 per 1,000) and was at the height at the close of WWII (16 per 1,000).
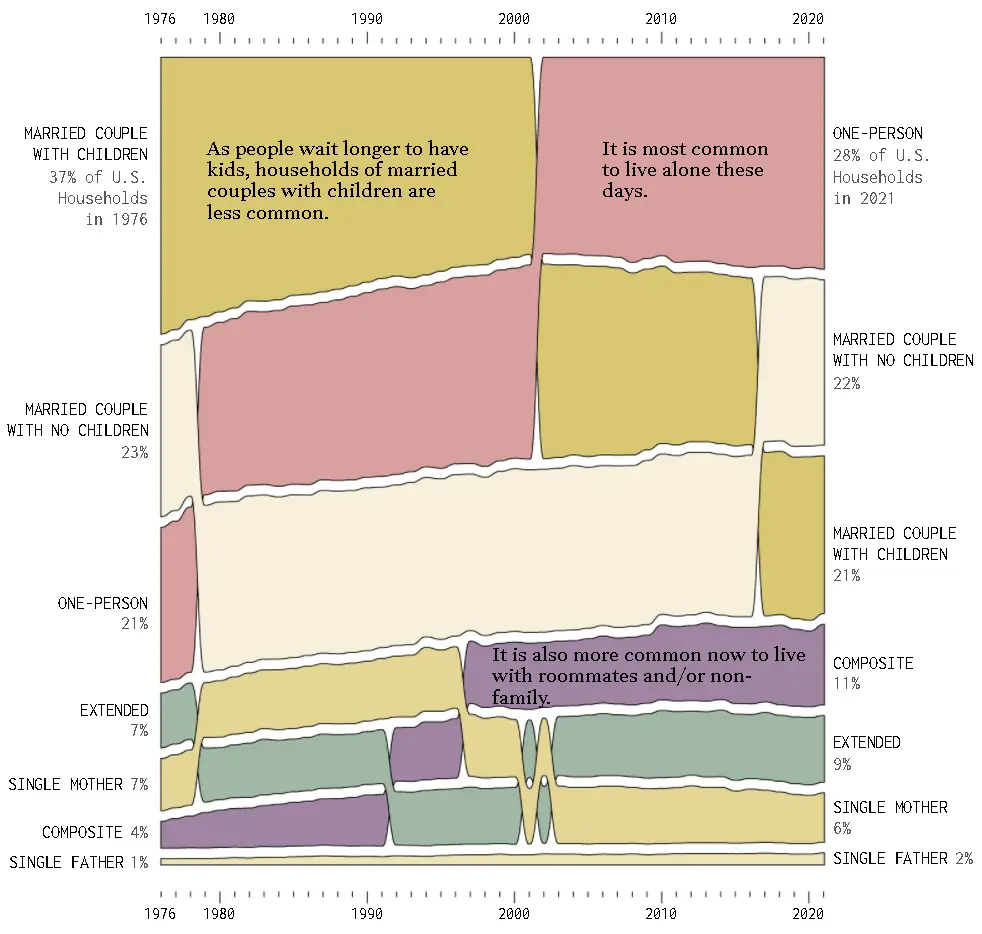
In the 1970s, the most typical household type in the United States was a married couple with kids. But over time became more common to live not married. The graph below created by Flowingdata vividly illustrates these changes between 1976 through 2021.
Since from 1990 levels, the U.S. marriage rate has fallen from 9.8 marriages per 1,000 down to 5.1 marriages per 1,000 population in 2020. That marriage rate is the lowest level since the U.S. administration began keeping marriage registers for the nation in 1867.
Some of the significant factors behind the long-term decrease in the marriage rate have been female education and labor workforce participation, women’s economic freedom, and gender equality.
Additional factors contributing to declining marriage rates are decreasing religious adherence to marriage and public disenchantment with marriage.
Postponing marriage has also played a role in lower marriage rates. The median ages at first marriage are currently 30 years for men and 28 years for women, about 8 years higher than in the 1950s. Also, the percentage of American adults aged 18 to 34 years married more than halved.
In addition to postponing marriage, record proportions of young U.S. adults are expected never to marry.
Today Utah has the highest married population in the United States.
The top 10 U.S. states have the highest percentage of married people in the US
| Rank | State | Married population, % | Marriage rate per 1,000 residents | Divorce rate per 1,000 residents |
|---|---|---|---|---|
| 1 | Utah | 56.1 | 8.7 | 3.4 |
| 2 | 54.9 | 7.8 | 3.9 | |
| 3 | Wyoming | 53.6 | 7.1 | 4.0 |
| 4 | Nebraska | 53.1 | 6.3 | 3.0 |
| 5 | Iowa | 52.8 | 6.2 | 2.0 |
| 6 | Kansas | 52.2 | 6.0 | 2.4 |
| 7 | New Hampshire | 52.4 | 7.0 | 3.1 |
| 8 | North Dakota | 52.3 | 5.8 | 2.5 |
| 9 | Minnesota | 52.2 | 5.6 | N/A |
| 10 | Montana | 52.2 | 8.0 | 3.1 |
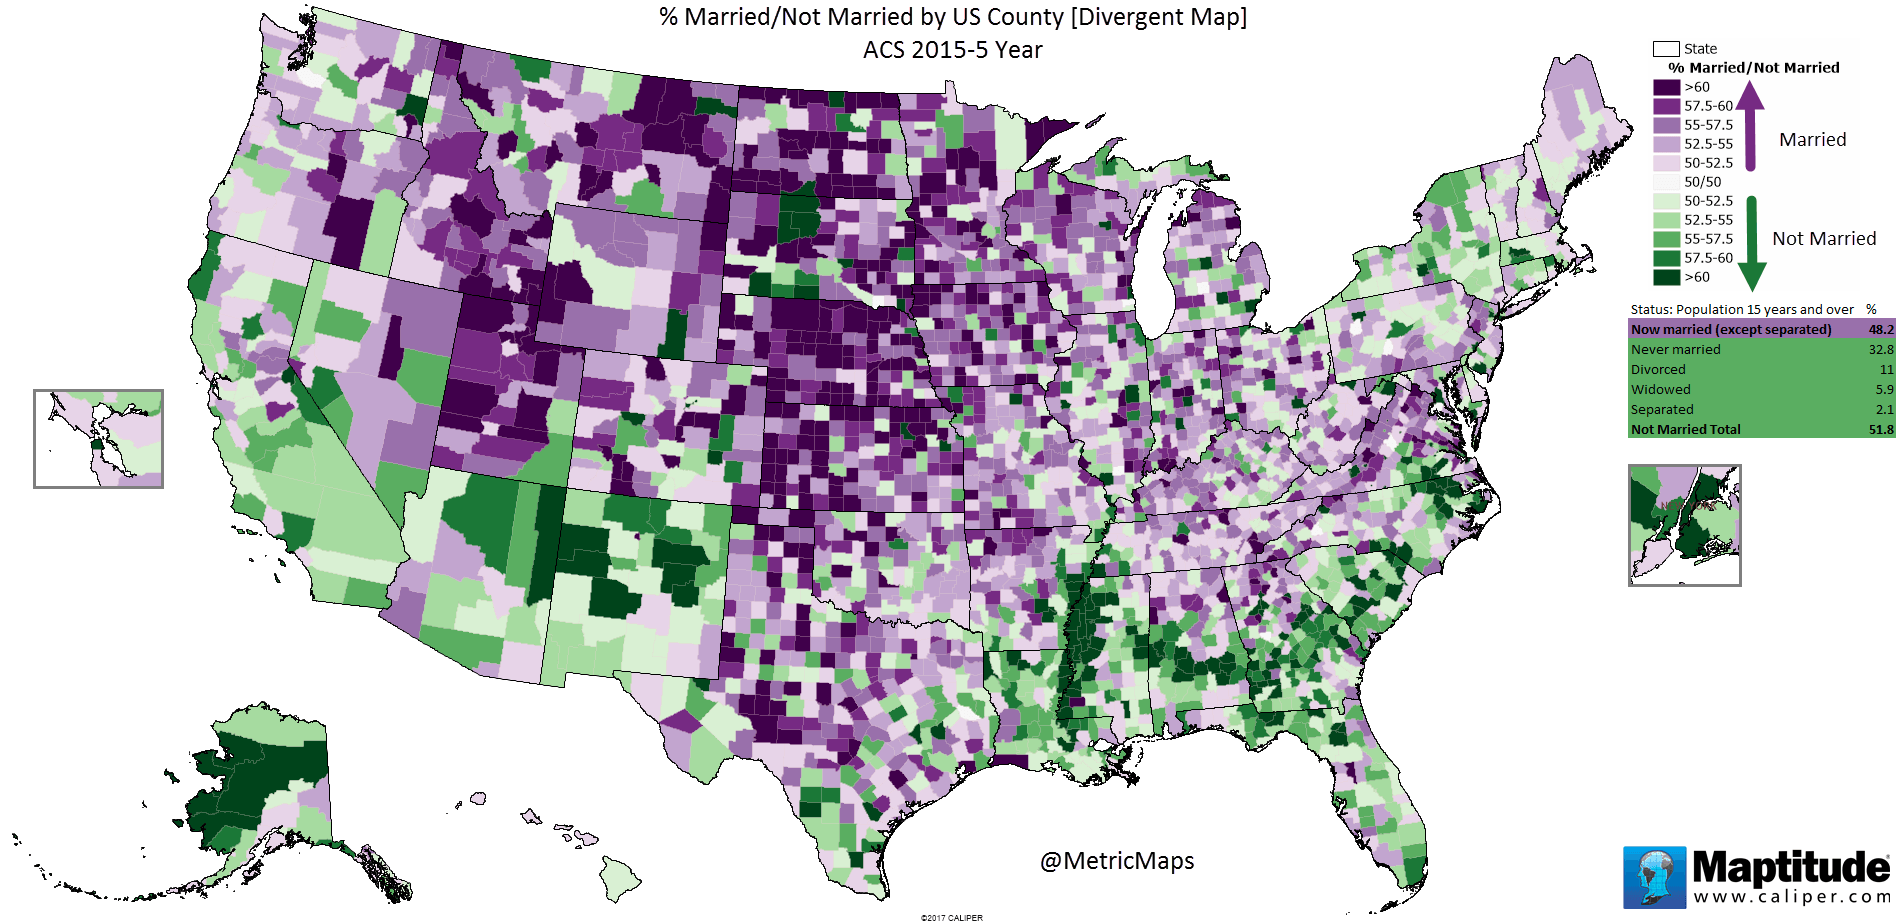
The map below shows the percentage of married couples by U.S. county, created by MetricMaps.org
Although marriage rates differ among main social groups in the U.S., those rates by and large have declined over the recent past. Black Americans are considerably more likely to be unmarried than whites and Hispanic Americans, 47% versus 28% and 27%, respectively. The rates for Asian Americans have stayed essentially unchanged.


Hmm, I thought that my County would be a much darker shade of green.
Gee look at all the marrieds in the mid west….