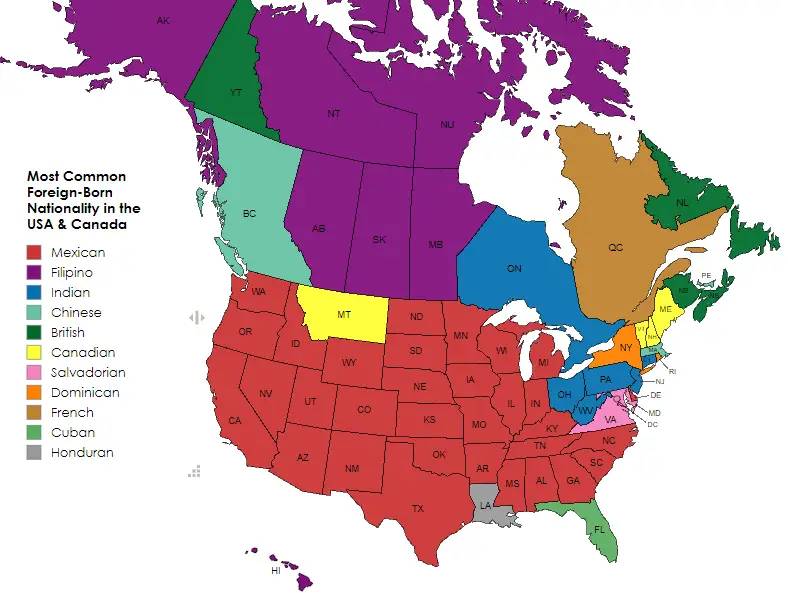
A fascinating map created by Reddit user ExcitingNeck8226 reveals the most common foreign-born nationality in each U.S. state and Canadian province. Using data from the 2020 U.S. Census and the 2021 Canadian Census, the map highlights immigration patterns across North America, showing striking differences between the two neighboring nations.
The map identifies 11 different nationalities as the most common foreign-born groups across the U.S. and Canada:
United States
Mexican: Found in 38 states, including Texas, California, and Arizona.
Filipino: Common in Alaska and Hawaii.
Indian: Prominent in New Jersey, Pennsylvania, and Connecticut.
Chinese: Found in Massachusetts.
Salvadorian: Dominates in Virginia, Maryland, and Washington, D.C.
Dominican: Found in New York and Rhode Island.
Cuban: Most common in Florida.
Honduran: Found in Louisiana.
Canadian: Common in states bordering Canada, like Montana, Vermont, and New Hampshire.
Canada
Filipino: Leads in Alberta, Saskatchewan, Manitoba, and Nunavut.
Indian: Most common in Ontario.
Chinese: Found in British Columbia.
British: Dominates Yukon, Newfoundland and Labrador, New Brunswick, and Nova Scotia.
French: Found in Quebec.
In the United States, Latin America heavily influences immigration patterns. This is evident in the overwhelming presence of Mexican-born populations in 38 states. Meanwhile, smaller but significant communities of Salvadorian, Dominican, Cuban, and Honduran immigrants highlight the cultural ties between the U.S. and its southern neighbors.
Canada, on the other hand, reflects a different set of trends. Asian immigrants, particularly from the Philippines, India, and China, are the most prominent groups in many provinces.
One of the most striking features of the Canadian data is the continued prominence of British and French immigrants in specific regions. The Maritime provinces (Newfoundland, New Brunswick, and Nova Scotia) reflect deep historical ties with Britain, while Quebec remains a bastion of French-born residents.
This map provides an engaging snapshot of how migration patterns have evolved over time. In the U.S., immigration from Latin America has been a defining feature for the past 60 years, while Canada’s reliance on immigration to sustain economic growth has focused on skilled labor from Asia. This divergence reflects differences in policy and geography. For instance, Canada’s immigrant selection process, which prioritizes skills and education, has led to diverse Asian representation, including Indian and Filipino communities. Meanwhile, the U.S., with its geographical proximity to Latin America, sees more immigrants arriving through family reunification or economic opportunities.
Some observations from the map stand out. For example, Filipino immigrants have established vibrant communities not only in Canada’s urban areas but also in its northern territories. This could be attributed to Canada’s temporary foreign worker programs, which draw individuals to work in healthcare and other essential industries. In the U.S., the presence of Canadian-born individuals in states like Vermont and Maine may reflect historical ties and cross-border mobility.
What about Yukon? The map shows British-born residents as the most common foreign-born group there. While Yukon’s rugged terrain and sparse population might not seem immediately appealing, its economic opportunities in mining and natural resources have likely drawn immigrants seeking adventure and employment.
What do you think about these immigration patterns? Share your thoughts in the comments below!


")


