The Rainforest Alliance’s global reach
The Rainforest Alliance’s work is driven by the principle that the health of the land is inextricably linked to the
Read more: The Rainforest Alliance’s global reach
The Rainforest Alliance’s work is driven by the principle that the health of the land is inextricably linked to the
Read more: The Rainforest Alliance’s global reachThe paint-like swirls of this visualization from Los Alamos National Laboratory depict global water-surface temperatures, with the surface texture driven
Read more: Map of Global Ocean TemperaturesThe Top 10 countries drinking the most beer (liters per capita) 1. Czech Republic – 142.4 2. Seychelles – 114.6
Read more: Map of world by beer consumption in litres per capitaTemperate deciduous forests are found in middle latitudes with temperate climates. Deciduous means that the trees in this forest change
Read more: Deciduous Forests of AmericaRoad traffic injuries caused an estimated 1.25 million deaths worldwide. That is, one person is killed every 25 seconds. Only
Read more: Road fatalities per 100,000 inhabitants per yearThe number of internet users in the Scandinavian countries has greatly outpaced the europe by comparison.
Read more: Internet Users in EuropeNew psychological tests suggest that China’s history of rice farming has given the south more markers of traditional East Asian
Read more: Regional Patterns of Collectivism in China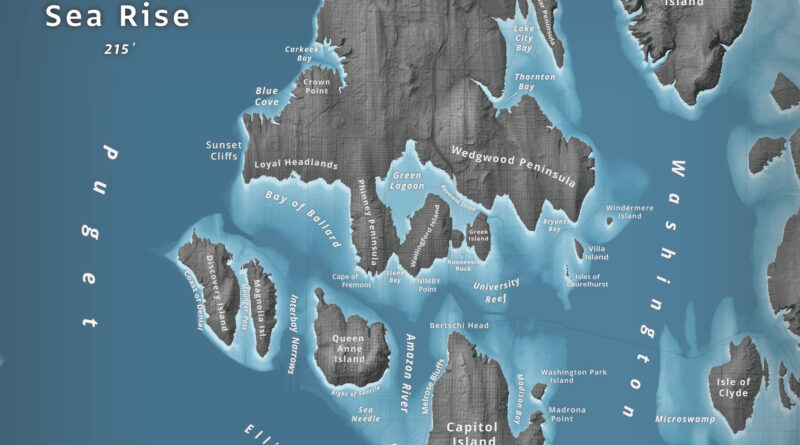
What happens to Seattle when 66 meters of water flood Puget Sound? Jeffrey Linn used LiDAR elevation data to map the city as an archipelago, where Capitol Hill becomes “Capitol Island” and the Space Needle turns into the “Sea Needle.” He created two versions with different cartographic styles.
Read more: Islands of SeattleWe may live in a world defined by invisible meta-data and the Cloud, but the roughly 3×5 inch paper booklet
Read more: How Powerful Is Your Passport?Data from satellite sensors show that during the Northern Hemisphere’s growing season, the Midwest region of the United States boasts
Read more: Satellite Shows High Productivity from U.S. Corn BeltUS economic growth in 2015 was strongest since 2005 (18.04 trillion USD (56,207.04 per capita)).
Read more: This map shows US states labeled as countries with similar GDPsTop 15 Largest Border Differences in USD (GDP per capita) Richer Country vs Poorer Country Qatar (102,100) – Saudi Arabia
Read more: Difference in GDP Per Capita Along The Worlds Borders