Precipitation Across America
The United States exhibits exceptional climatic diversity. Annual precipitation in the country ranges from approximately 50 millimeters per year, equivalent to 2.0 inches in Death Valley, to more than 11,700 millimeters per year, or about 460 inches, on Mount Waiʻaleʻale in Kauaʻi.
Precipitation doesn’t line up neatly with temps. Lots of southern places hit around 21°C (70°F) on average, but southern Florida usually pulls in about 1,270 mm (50 inches) a year, compared to those wide open inland Southwest areas scraping by near 254 mm (10 inches).

Take this map from 1961-1990. Nevada came out as the driest back then with 241 mm (9.5 inches), and Hawaii’s average across the islands was a lot higher, around 1,618 mm (63.7 inches).
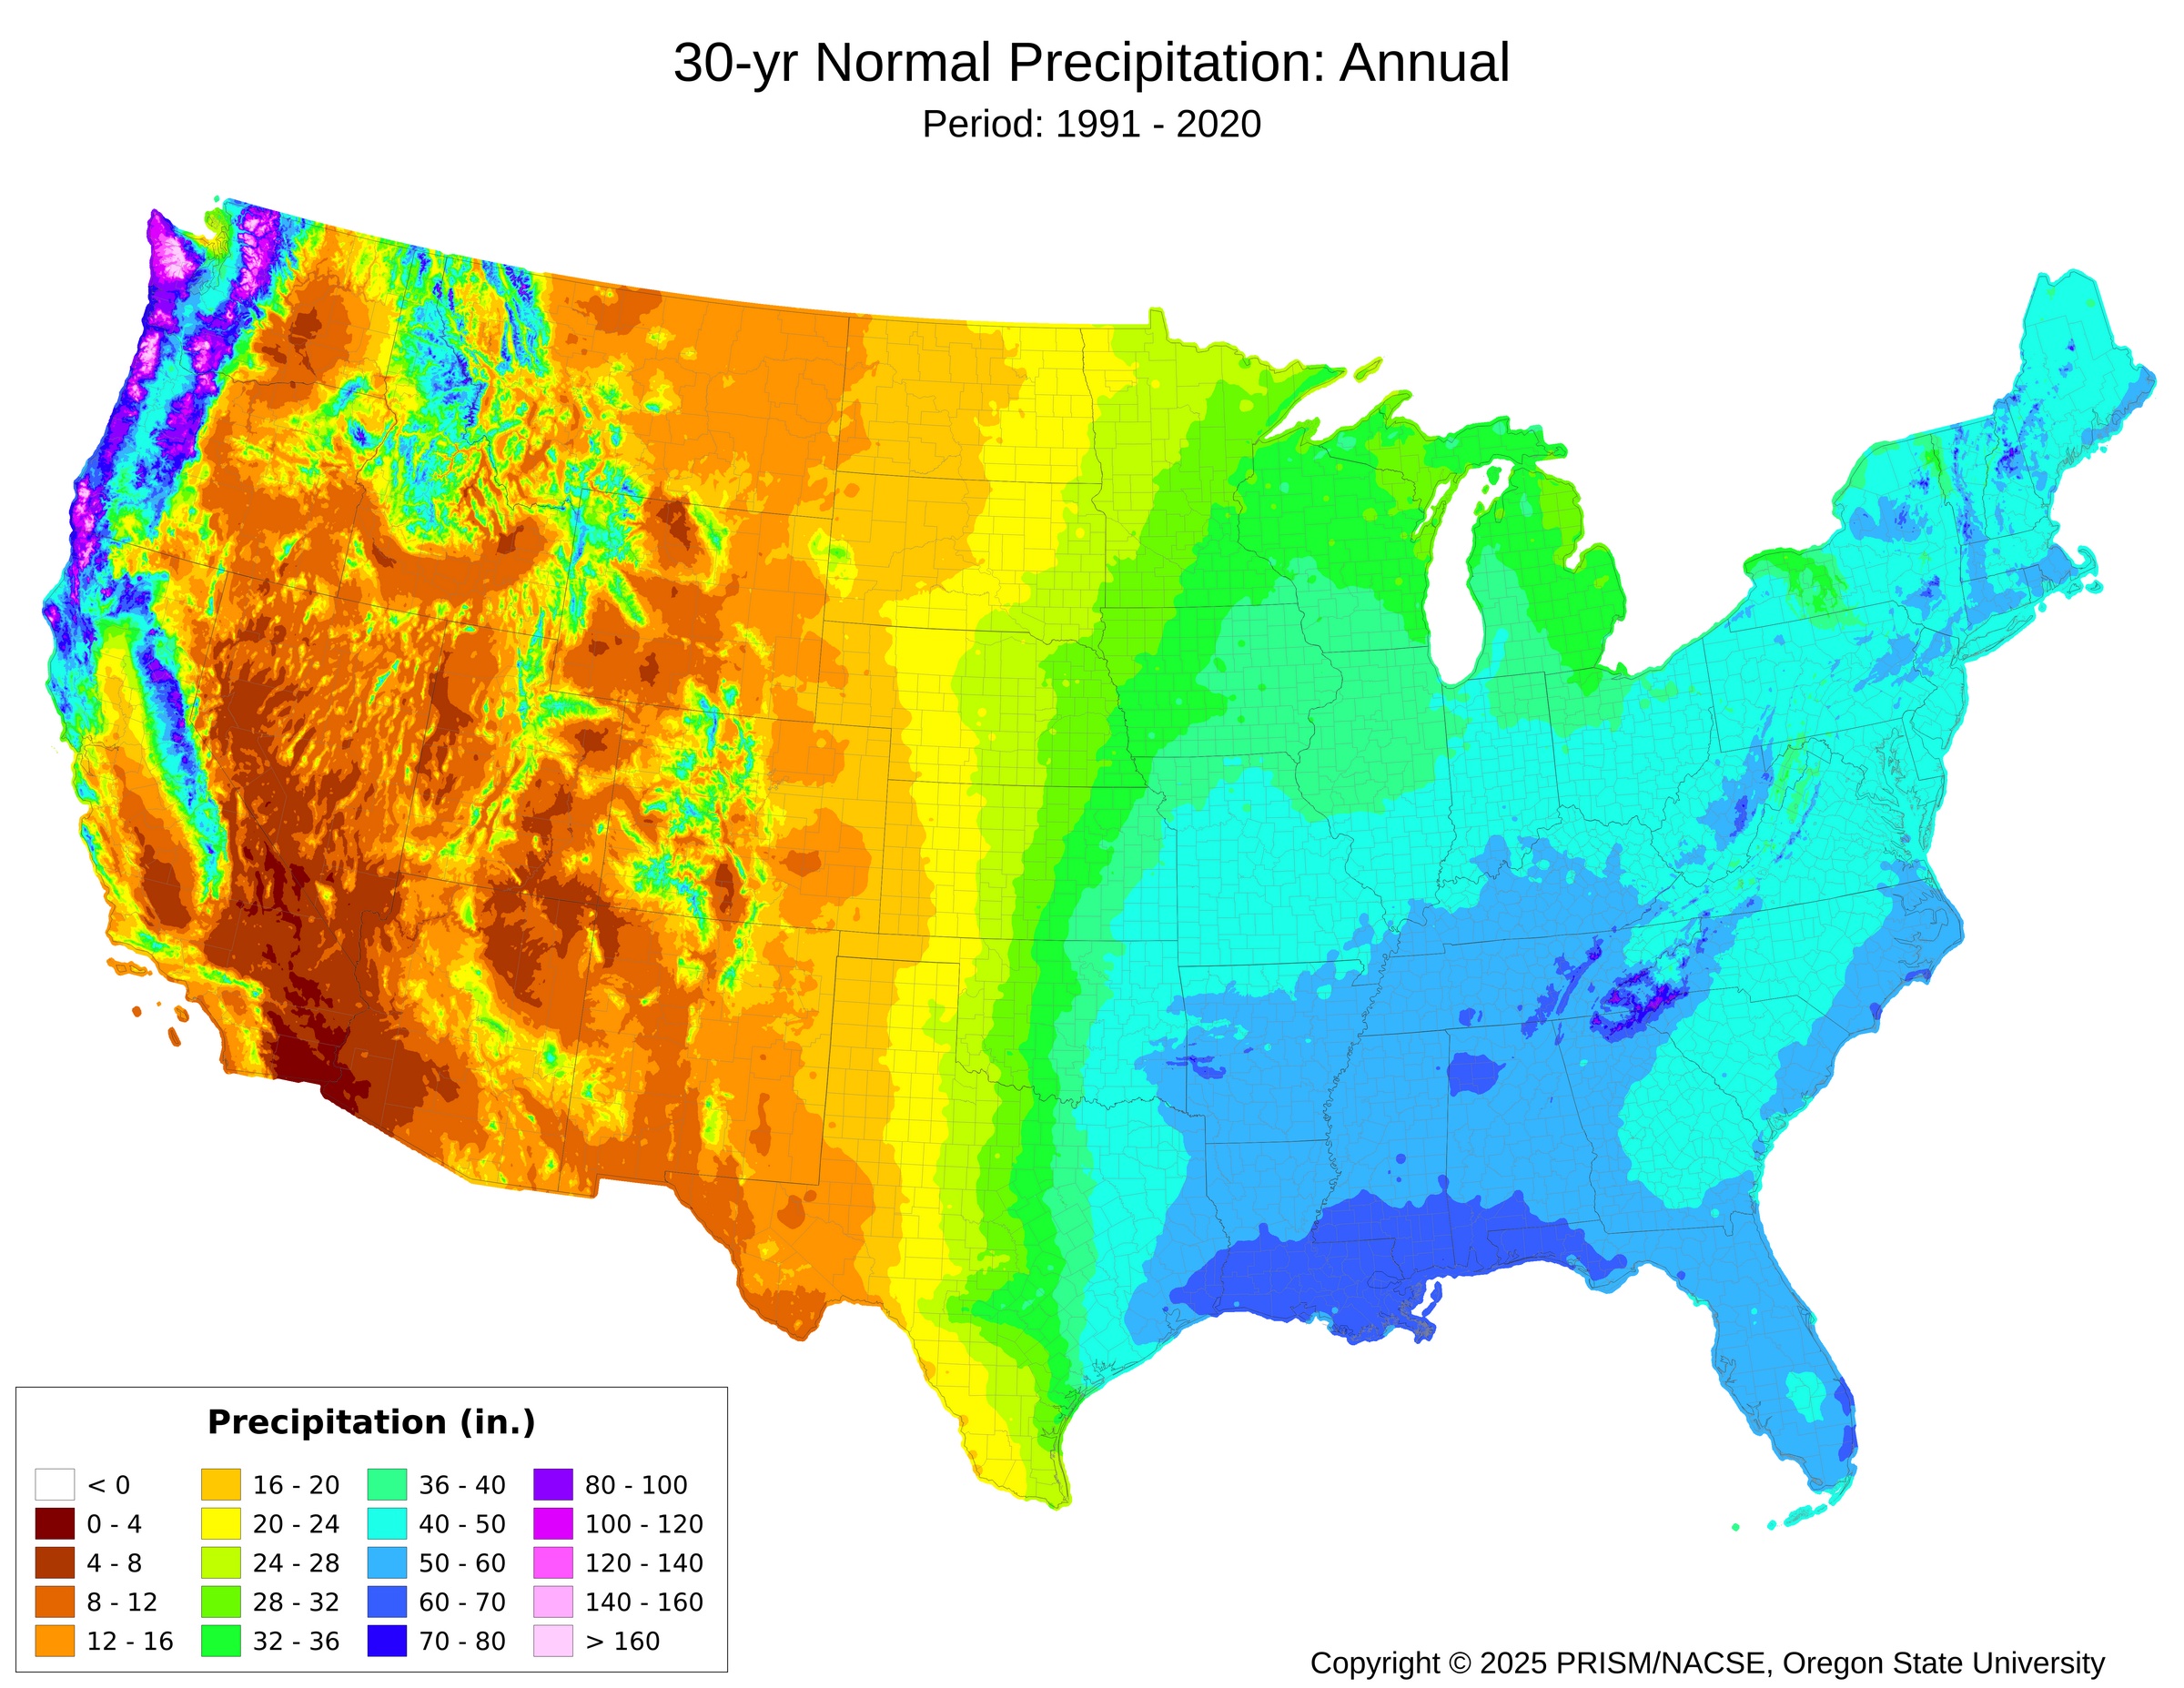
Then there’s this version created by the team of the Oregon State University using PRISM data over 1991-2020.
Nationwide, the numbers don’t budge much over decades, but cut it regionally and you see shifts. From 1901 on, the lower 48 added roughly 4.6 mm (0.18 inches) every decade, adding up to around 46 mm (1.8 inches) through a century. That hides the splits though—northern and northeastern bits tend to get more these days, southwest less so.
[INSERT ANIMATED MAP: Precipitation Rivers visualization]
The Joy Division styled animated map below reimagines rivers as undulating “ridges”, scaled to the annual amount of precipitation.
What about the future? Climate models suggest the North will get 5-10% wetter by 2050 while the South becomes 1-5% drier (Under the SSP2-4 scenario). The northern states and Alaska should see more winter and spring precipitation. The Southwest should see less during those seasons.
The models also predict bigger swings. The western US will probably see more extreme year-to-year variability, with sharper transitions between very dry and very wet periods. Heavy precipitation events should get more frequent and more intense through this century.


")
?")