The atlas of the United States in the style of Joy Division
Profiles have long been applied to show a change in slope by representing the variations in height along as if the terrain has been sliced open.
The same method can be applied to depict the variety in any measurable value across a surface, with lines representing a value of data vertically, such as in this extract of altitude, precipitation, population, or whatever.
The name ‘Joy Plot’ was invented by Jenny Bryan in 2017 and referred to the original presentation album “Unknown Pleasures,” released in 1979 by Joy Division, from England. Joy Division became one of the most influential post-punk groups. The album’s cover “Unknown Pleasures” was a reinterpretation of the image of radio waves from the first observed pulsar.

Cornell student Harold Craft showed the original model in 1970 in his thesis, and then the image was printed in the Cambridge Encyclopedia of Astronomy.
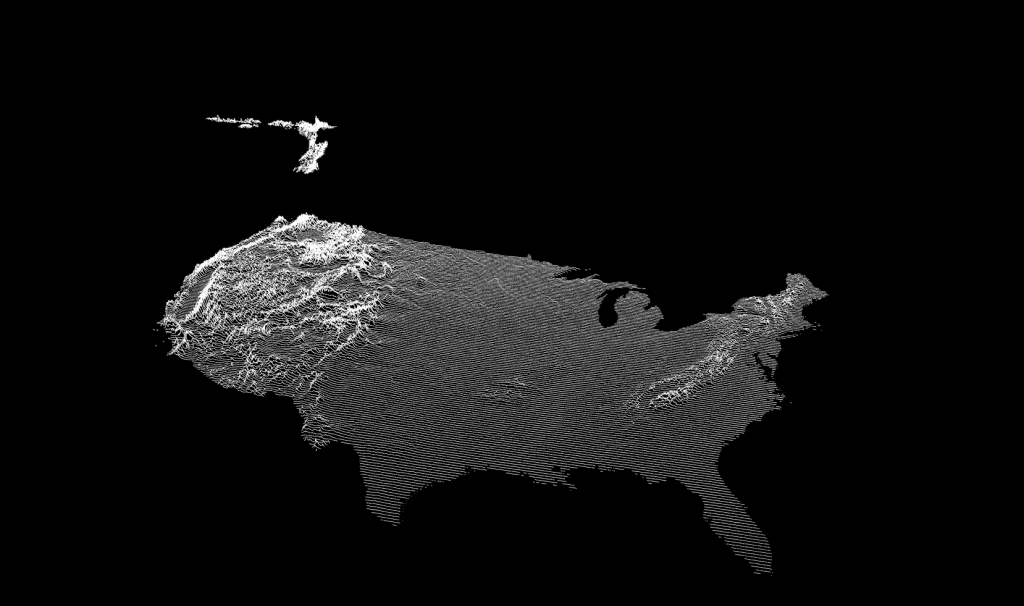
Below is my attempt to show elevation, precipitation, and population density in the United States in the style of Joy Division.
The United States of elevation
The annual amount of precipitation in the United States

The population density in the U.S.

But we can use roads and rivers instead of lines as well.
Roads and elevation
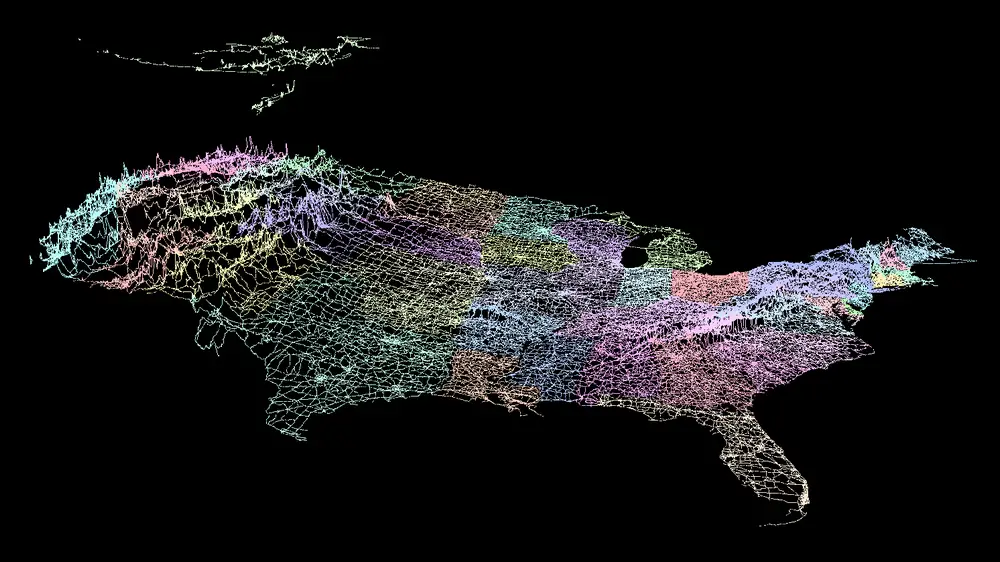
Roads and population density

Rivers and elevation

Rivers and the annual amount of precipitation


