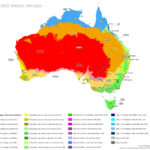
On the map below, dark green marks Major Cities, and it clings to the east and south-east coast, with a second patch around Perth in the south-west. Tasmania shows only the middle greens. Yellow, the colour of Very Remote Australia, covers the whole centre and the rainy north as well.
Australia’s remoteness map measures road distance to services, so it shows where settlements are located. Climate determined where people could live on this continent, and history decided where they settled first, in coastal ports from 1788 onward. The dry centre is empty because of aridity, while the rainy north is empty because of a short wet season, cyclones, poor soils and a distant market.
How does Australia measure remoteness?
The Australian Bureau of Statistics builds five Remoteness Areas from the ARIA+ index, which rests on road distance to services. The colours go from yellow for Very Remote and light green for Remote, through deepening greens for Outer Regional and Inner Regional, to dark green for Major Cities.
Remoteness class
Map colour
Share of Australians, 30 June 2023
Very Remote
Yellow
0.7%
Remote
Light green
1.1%
Outer Regional
Lighter green
8.0%
Inner Regional
Green
18%
Major Cities
Dark green
73%
Is the remoteness map shaped by climate or by history?
Both. In 2001, 85% of Australians lived within 50 km (31 mi) of the coast (ABS). Climate drew that outline, since the interior is arid and even Sydney struggled to feed itself in its first decades on infertile soil. History chose the spots inside it. The First Fleet anchored at Sydney Cove in 1788 (State Library of NSW), and the Swan River Colony followed in 1829 on the far side of the continent (Wikipedia). Perth lies 2,700 km (1,677 mi) from Sydney by road, which is why it shows as a separate dark green patch.
Why is northern Australia so empty when it rains so much?
The north covers 53% of Australia’s land and holds 5.3% of its people. Water is not the shortage, since Darwin averages 1,727 mm (68 in) of rain a year. The trouble is timing. Across the Top End, about 1,594 mm (63 in) falls from November to April, against 113 mm (4.4 in) from May to October, and evaporation at Darwin averages 2,630 mm (104 in) a year. Cyclone Tracy added risk in 1974, when winds of 217 km/h (135 mph) hit Darwin and 35,362 of its roughly 47,000 residents were evacuated. Farming did not fill the gap either. Seasonal aridity and infertile, fragile soils limit cropping, and the main market lies far away in south-east Australia.