The spatial distribution of leading minority groups across the United States reflects a dynamic interplay of historical, social, economic, and geographic factors, resulting in diverse patterns of settlement and concentration.
African Americans, as one of the largest racial minorities, have historically been concentrated in the Southern states, particularly in the Mississippi Delta region and urban centers like Atlanta, New Orleans, and Memphis. However, significant African American populations also exist in cities throughout the Midwest and Northeast, including Chicago, Detroit, Philadelphia, and New York City, where they have played pivotal roles in shaping cultural, political, and economic landscapes.
Hispanic Americans, comprising the largest ethnic minority, exhibit varied distribution patterns influenced by migration patterns, historical ties, and economic opportunities. States with long-standing Hispanic populations, such as California, Texas, Florida, and New York, have significant concentrations, with vibrant communities in cities like Los Angeles, Miami, Houston, and New York City. Additionally, Hispanic populations are increasingly dispersing into suburban areas and emerging immigrant destinations across the Midwest and Southeast.
Asian Americans, primarily concentrated on the West Coast, have substantial populations in states like California, Washington, and Hawaii, where diverse ethnic groups, including Chinese, Filipino, Vietnamese, Korean, and Indian communities, contribute to vibrant cultural landscapes. Urban centers like Los Angeles, San Francisco, Seattle, and Honolulu serve as hubs of Asian American culture and commerce, while significant populations also reside in East Coast cities like New York City and Washington, D.C., reflecting diverse migration patterns and economic opportunities.
American Indians and Alaska Natives, deeply rooted in indigenous lands, are predominantly concentrated in the Western and Southwestern regions, including states like Oklahoma, Arizona, New Mexico, and Alaska. Tribal reservations serve as focal points of indigenous cultures and communities, preserving traditional lifestyles and customs while grappling with contemporary challenges. Alaska Natives, including Inuit, Yup’ik, and Aleut peoples, maintain strong ties to their ancestral lands in Alaska, where subsistence lifestyles and cultural practices endure alongside modern development.
We’ve previously shared maps showcasing the leading groups by U.S. county. Now, let’s explore the spatial distribution of the ethnic groups that rank as the second largest in each county.
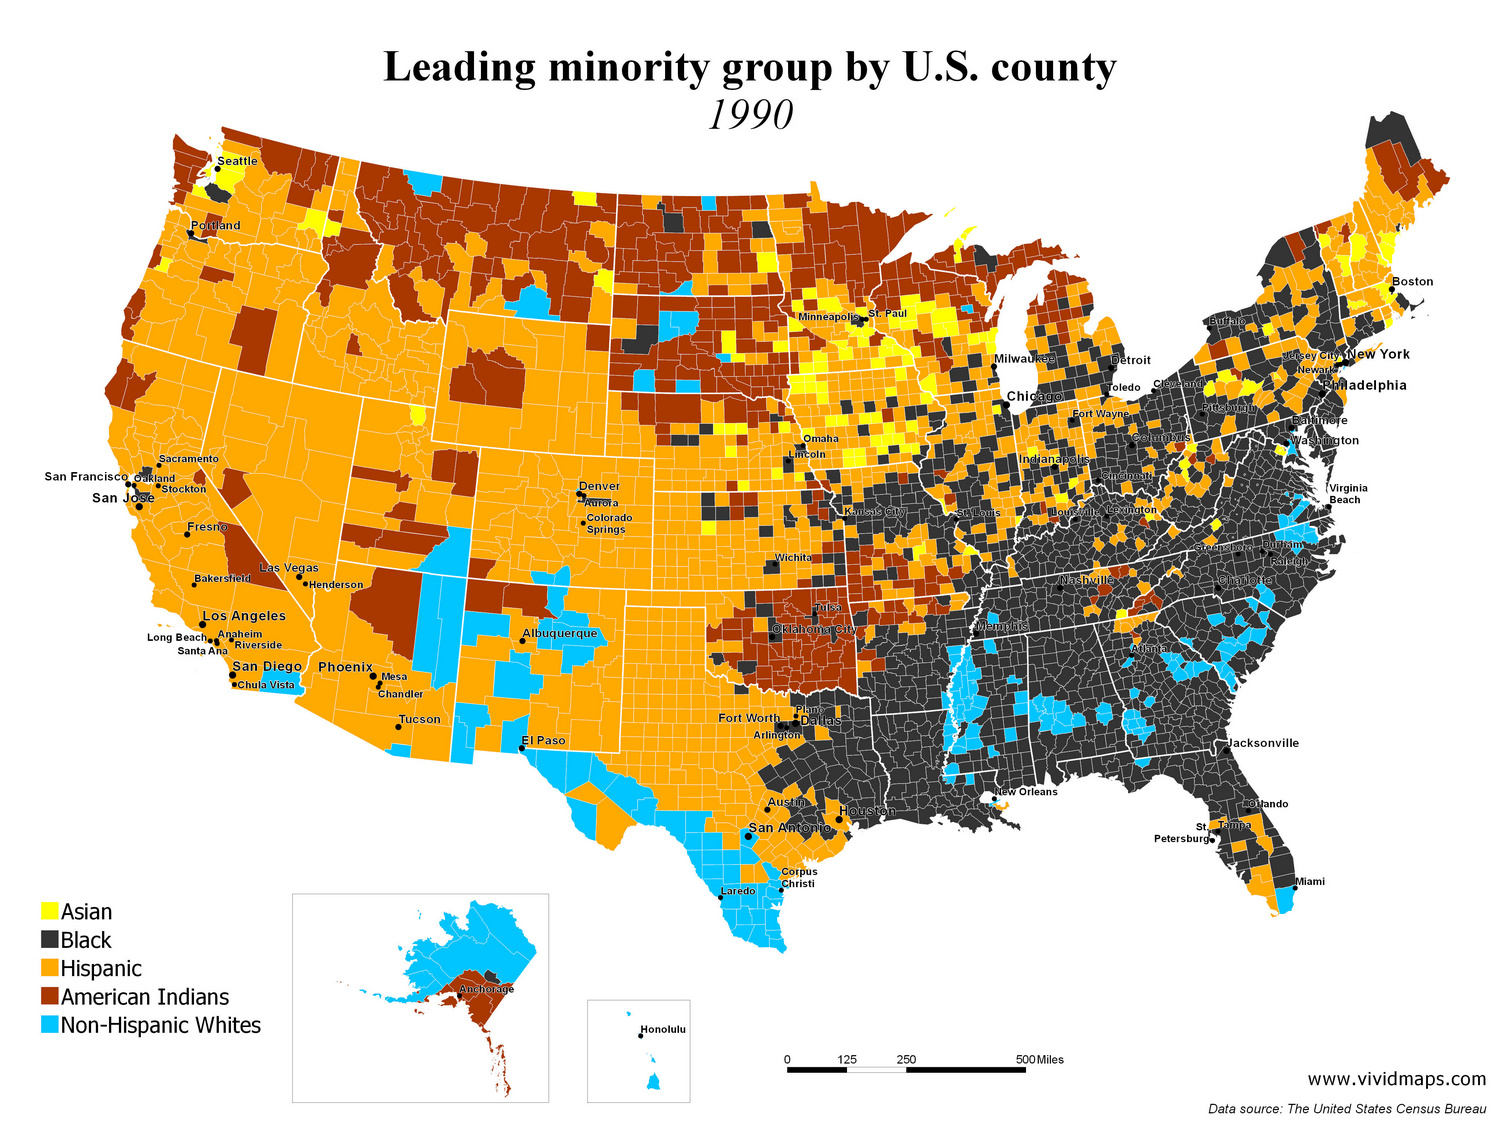
These maps of the United States show changes in the leading minority group by U.S. county in 1990 vs 2022.
Below, you’ll find an animated video showcasing the evolution of the predominant minority group in each U.S. county over time.
As of 2022, here are the estimated populations and percentages of each ethnic group in the United States:
African Americans: Approximately 44 million, comprising around 13% of the total U.S. population.
Hispanic Americans: Around 63 million, making up approximately 19% of the total U.S. population.
White, non-Hispanic population: Approximately 198 million, accounting for around 60% of the total U.S. population.
Asian Americans: Around 24 million, constituting approximately 7% of the total U.S. population.
American Indians and Alaska Natives: Approximately 7 million, representing approximately 2% of the total U.S. population.
Compared to 1990, there have been significant changes in the population distribution among ethnic groups. While the White, non-Hispanic population still constitutes the majority, its proportion has decreased from around 75% in 1990 to approximately 60% in 2022. Conversely, Hispanic Americans have seen substantial growth, increasing from around 17.8% of the population in 1990 to approximately 19% in 2022. African Americans have maintained a relatively stable percentage of the population, while Asian Americans and American Indians/Alaska Natives have also experienced moderate growth.


The link for Hispanic population goes to nonHispanic White population. How do I get the Hispanic population only?