Mapping America’s Education Landscape
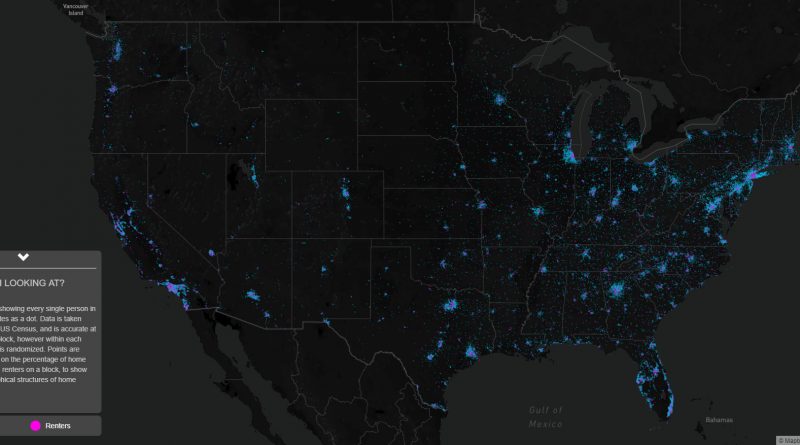
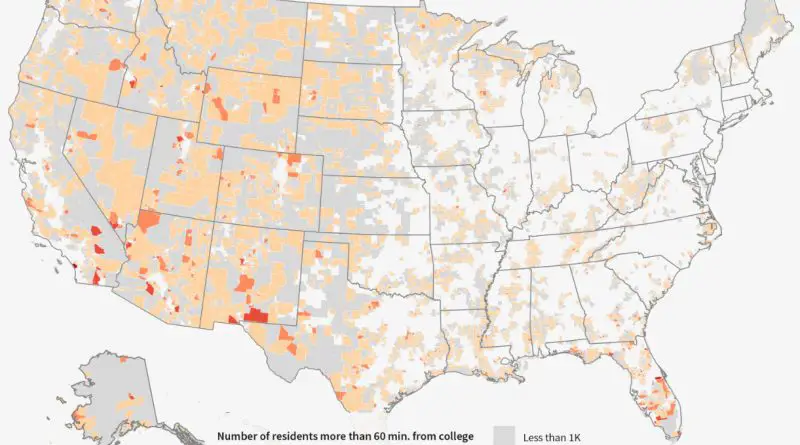
Dive into the complex world of American education through two revealing maps. One exposes “education deserts” where millions live far from colleges, while another highlights stark differences in school funding across the nation. These visualizations offer a unique perspective on educational access and investment across the United States.
Read More