What if we drew the map of the United States based on how people actually live?
Dr. Alasdair Rae and his co-author Dr. Garrett Nelson have developed an empirical approach to identify megaregions using a dataset of more than 4 million ‘commuter flows’ involving the travel to work patterns of 130 million Americans.
The data comes from five years worth of data from the American Community Survey between 2006 and 2010. The yearly nationwide survey of 3.5 million employees asks where they worked “last week”. The findings were published in PLOS One.
Instead of dividing the country up into the familiar outlines of states or Metropolitan statistical areas, this map shows what the U.S. might look like if we based our regions on the pattern which commuters weave every day between cities, suburbs, and rural areas. The white borders show the new geography of megaregions based on an algorithmic detection of related communities.
dartmouth.edu
These megaregions reveal the economic connections formed by millions of people commuting to and from work every day. They map out complicated networks in which economic systems, environmental resources, and infrastructure are combined.
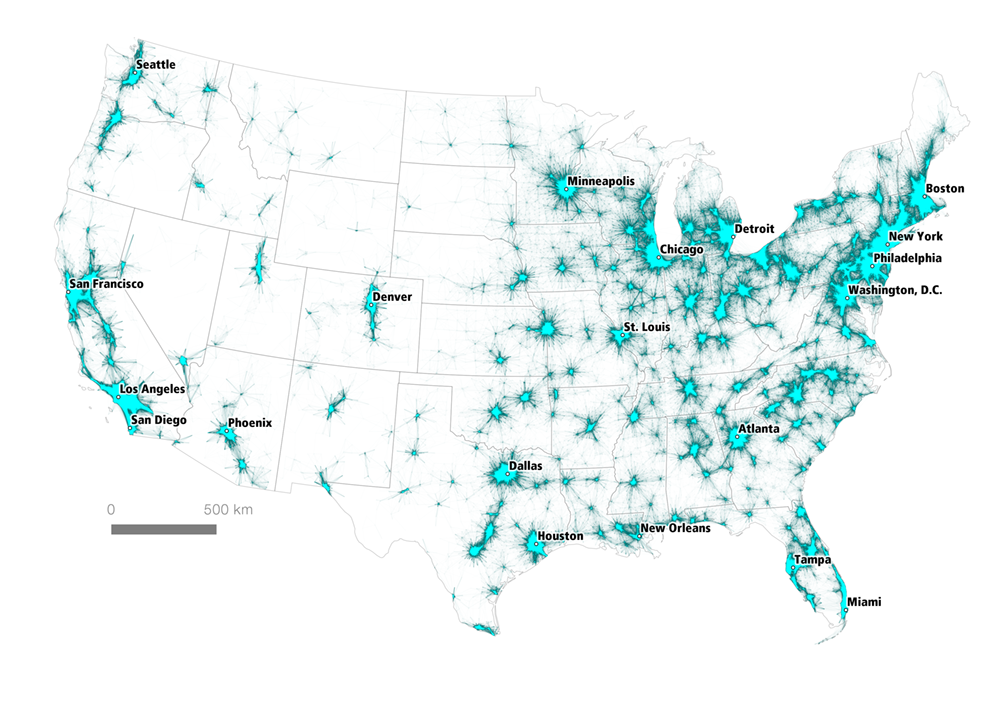
Here are visualization tract-to-tract commutes of 160 kilometers or less mapped across the United States.
On these maps, you can see appearing the northeast megapolis.


Or perhaps a guide to clear views of the night sky?