U.S. population aged 0-4 year
This post may contain affiliate links. As an Amazon Associate, we earn from qualifying purchases.
Today, the number of children aged 0-4 in the U.S. is 19.7 million. Between 2008 and 2020, the population aged 0-4 years in the United States was declining on average by 0.51 percent every year, although, before that, it rose from 16.6 million persons in 1979 to 21.1 million persons in 2008.
The map below is based on data from the Census that shows the U.S. population aged 0-4 years as a share of the total population in percentage.
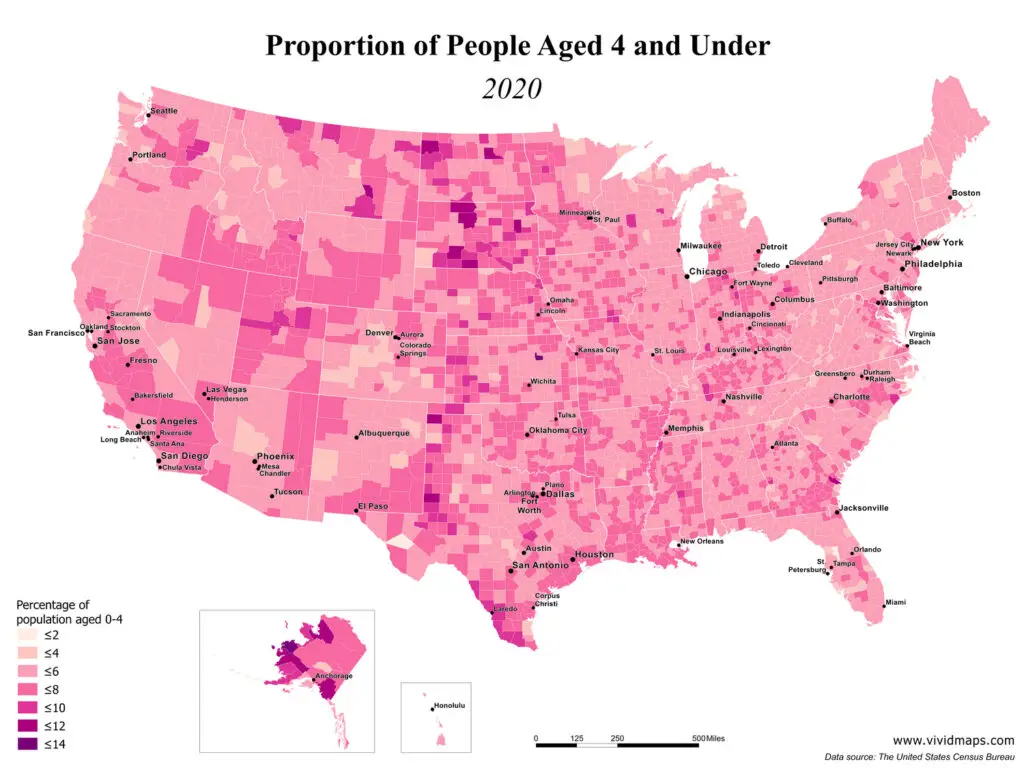
Top 10 U.S. counties by the highest percentage of children:
- Geary (Kansas): 12.0%
- Dewey (South Dakota): 11.8%
- Todd (South Dakota): 11.7%
- Jackson (South Dakota): 11.0%
- Bethel (Alaska): 10.9%
- Benson (North Dakota): 10.8%
- Corson (South Dakota): 10.7%
- Gaines (Texas): 10.5%
- Northwest Arctic (Alaska): 10.4%
- Treasure (Montana): 10.2%
Top 10 U.S. counties by the lowest percentage of children:
- Forest (Pennsylvania): 0.6%
- Jeff Davis (Texas): 1.2%
- Aleutians East (Alaska): 1.7%
- Sumter (Florida): 1.8%
- Carton (New Mexico): 2.0%
- McCormick (South Carolina): 2.2%
- Storey (Nevada): 2.4%
- Issaquena (Mississippi): 2.5%
- Crowley (Colorado): 2.5%
- Esmeralda (Nevada): 2.5%
Below is the map showing the population of people aged 4 and under changes by county from 2000 to 2020.

Here is the animated version of the map that shows the change of the U.S. population aged 0-4 years from 2000 to 2020.
Related posts:
")


")
South Dakota?
South Dakota has some of the worst Native American reservations in the country. Extremely low standards of living, which leads to low life expectancy and high birth rate.
This is an interesting way to show the local impact of the falling US birth rate.
You can clearly see that between 2000 and 2017, a smaller percentage of each county’s population is new children.
A trend like this has only happened twice in modern history.
Between 1990-1995 the fertility rate fell, but not as much as is currently happening.
But between 1960-1975 the fertility rate fell an unbelievable amount.
The social impact of that must have been crazy. Puts hippies and rock’n’roll and Disco into context.
I wonder how long our fertility rate can fall?