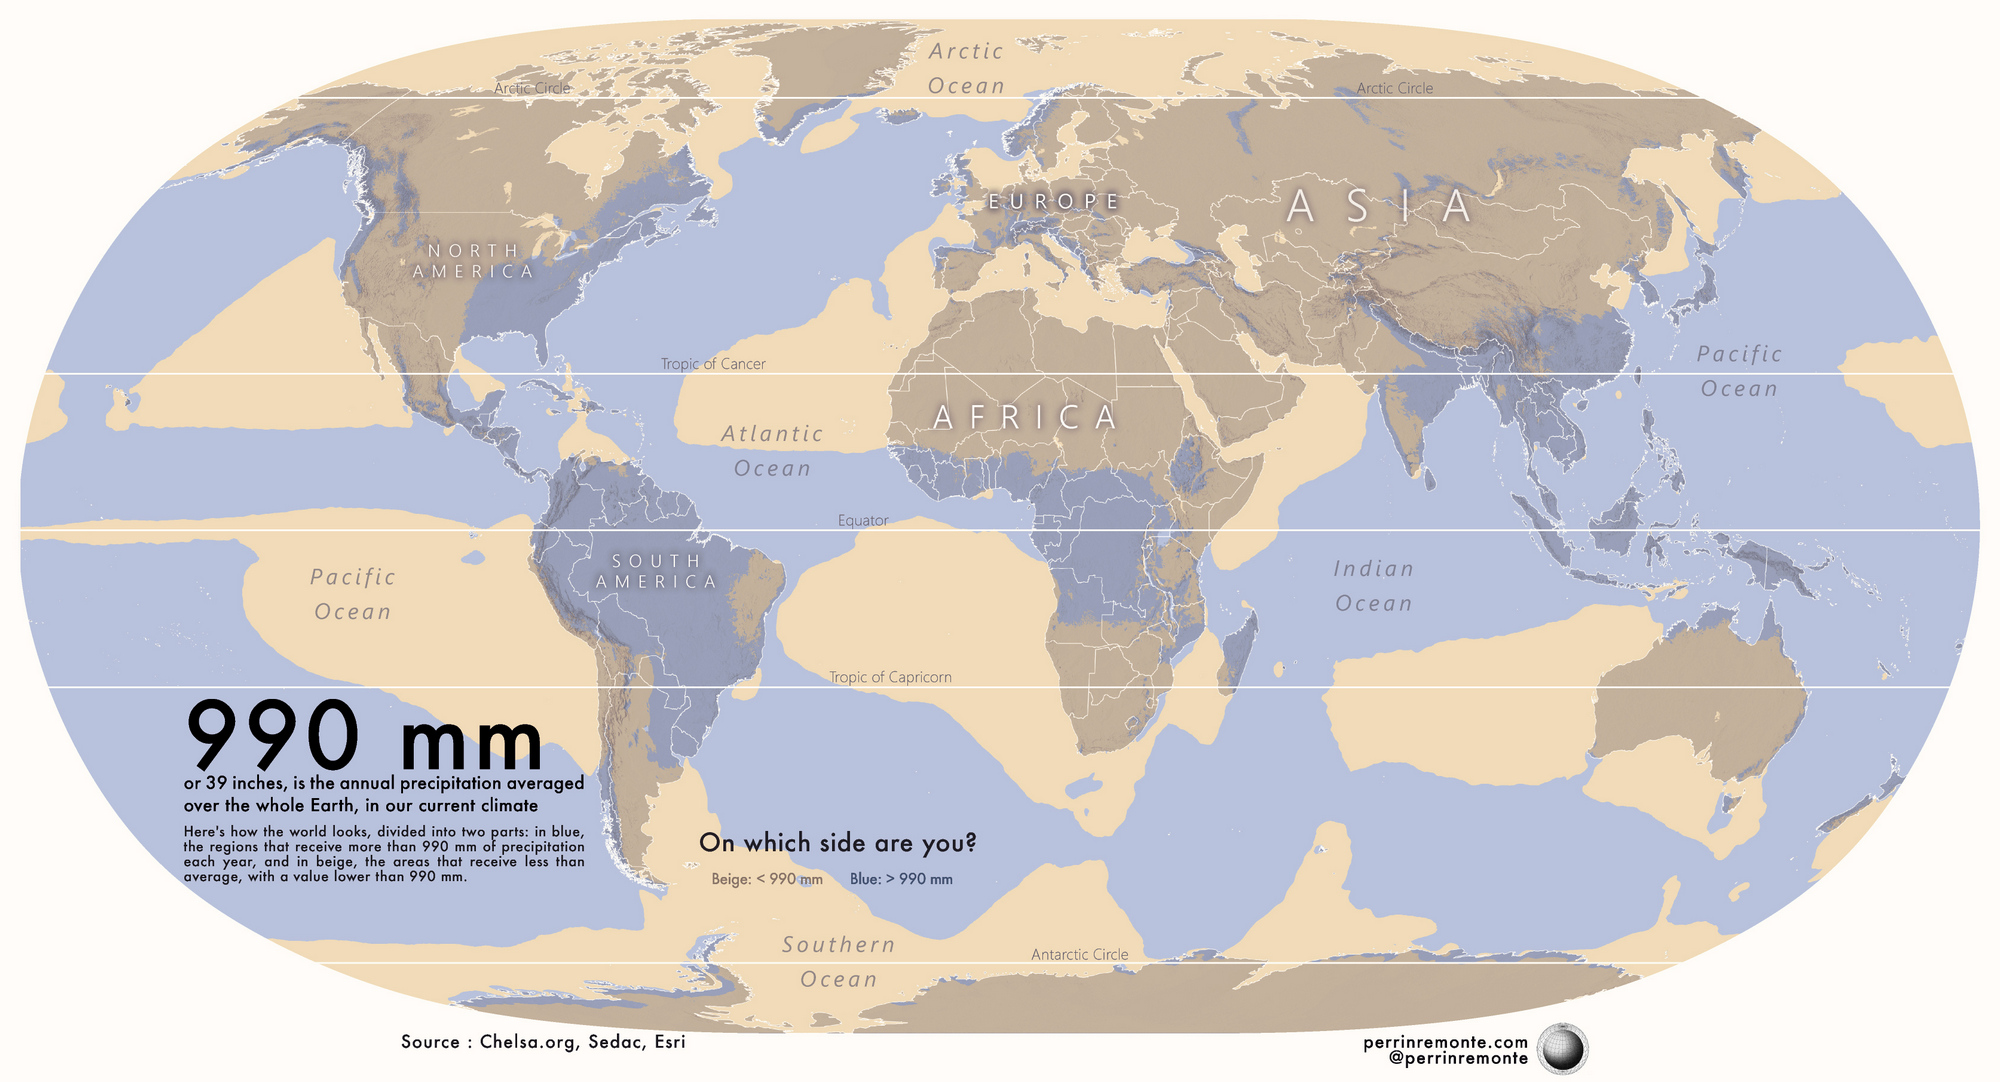
Each year, Earth receives about one meter (39 inches) of rainfall or snowfall on average. But this “global average” hides an enormous imbalance. From the lush slopes of tropical mountains to the parched heart of deserts, the distribution of precipitation is far from even.
Latitude, prevailing winds, mountain ranges, ocean currents, and even Earth’s axial tilt all shape where the rain falls—and where it doesn’t.
Cartographer Perrin Remonté captured this striking contrast using data from Chelsea Climate, dividing the planet into two halves:
Blue areas: more than one meter of precipitation annually (rain or snow)
Yellow/orange/red areas: less than one meter annually
Seasonal shifts – Earth’s tilt creates wet/dry seasons in many regions.
Climate change – Altered sea temperatures and shifting wind patterns are changing rainfall distribution.
Natural climate cycles – El Niño and La Niña events redistribute rainfall worldwide.
Vegetation & land use – Forests add moisture to the air through transpiration; urban areas can disrupt local precipitation.
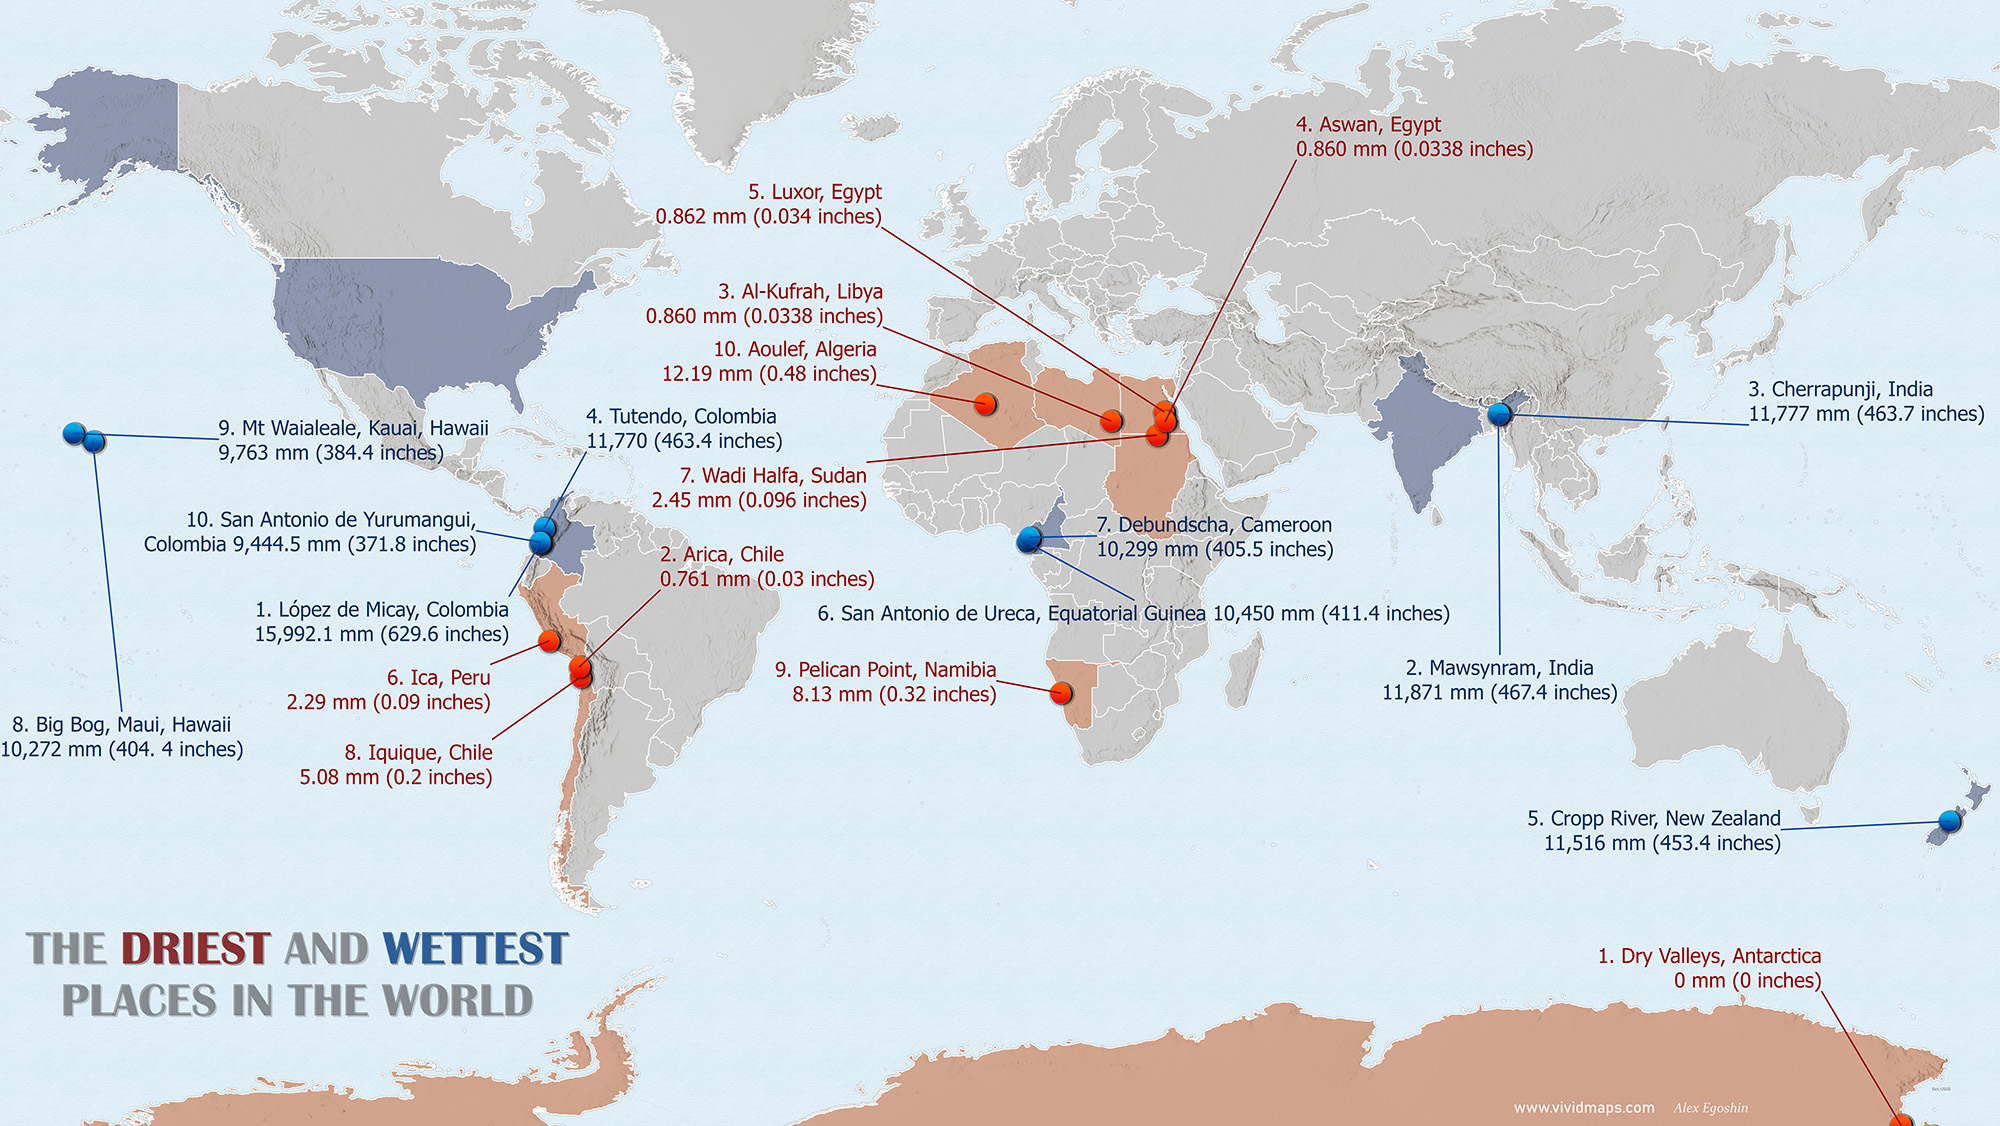
The Wettest Places on Earth
Many of the wettest spots are in tropical rainforest regions or along mountain slopes where warm, moisture-rich winds meet steep terrain. One standout is Mawsynram, India, where monsoon winds and steep hills create staggering rainfall totals.
Top 10 Wettest Places in the World
Rank
Place
Average Precipitation, mm
1
Colombia López de Micay, Colombia
15,992
2
Mawsynram, Meghalaya State, India
11,871
3
Cherrapunji, Meghalaya State, India
11,777
4
Tutendo, Colombia, South America
11,770
5
Cropp River, New Zealand
11,516
6
San Antonio de Ureca, Bioko Island, Equatorial Guinea
10,450
7
Debundscha, Cameroon, Africa
10,299
8
Big Bog, Maui, Hawaii
10,272
9
Mt Waialeale, Kauai, Hawaii
9,763
10
Kukui, Maui, Hawaii
9,445
Here is the map created by me that shows the driest and wettest places in the world.
The Driest Places on Earth
Deserts dominate this list, but the absolute driest spot isn’t in a desert at all – it’s in Antarctica’s McMurdo Dry Valleys. There, fierce katabatic winds can reach 200 mph (322 km/h), heating as they descend and evaporating every trace of moisture. These valleys are considered Earth’s environments closest to the Red Planet.
Top 10 Driest Places in the World
Rank
Place
Average Precipitation, mm
1
Dry Valleys, Antarctica
0
2
Arica, Chile
0.761
3
Al-Kufrah, Libya
0.860
4
Aswan, Egypt
0.861
5
Luxor, Egypt
0.862
6
Ica, Peru
2.29
7
Wadi Halfa, Sudan
2.45
8
Iquique, Chile
5.08
9
Pelican Point, Namibia
8.13
10
Aoulef, Algeria
12.19
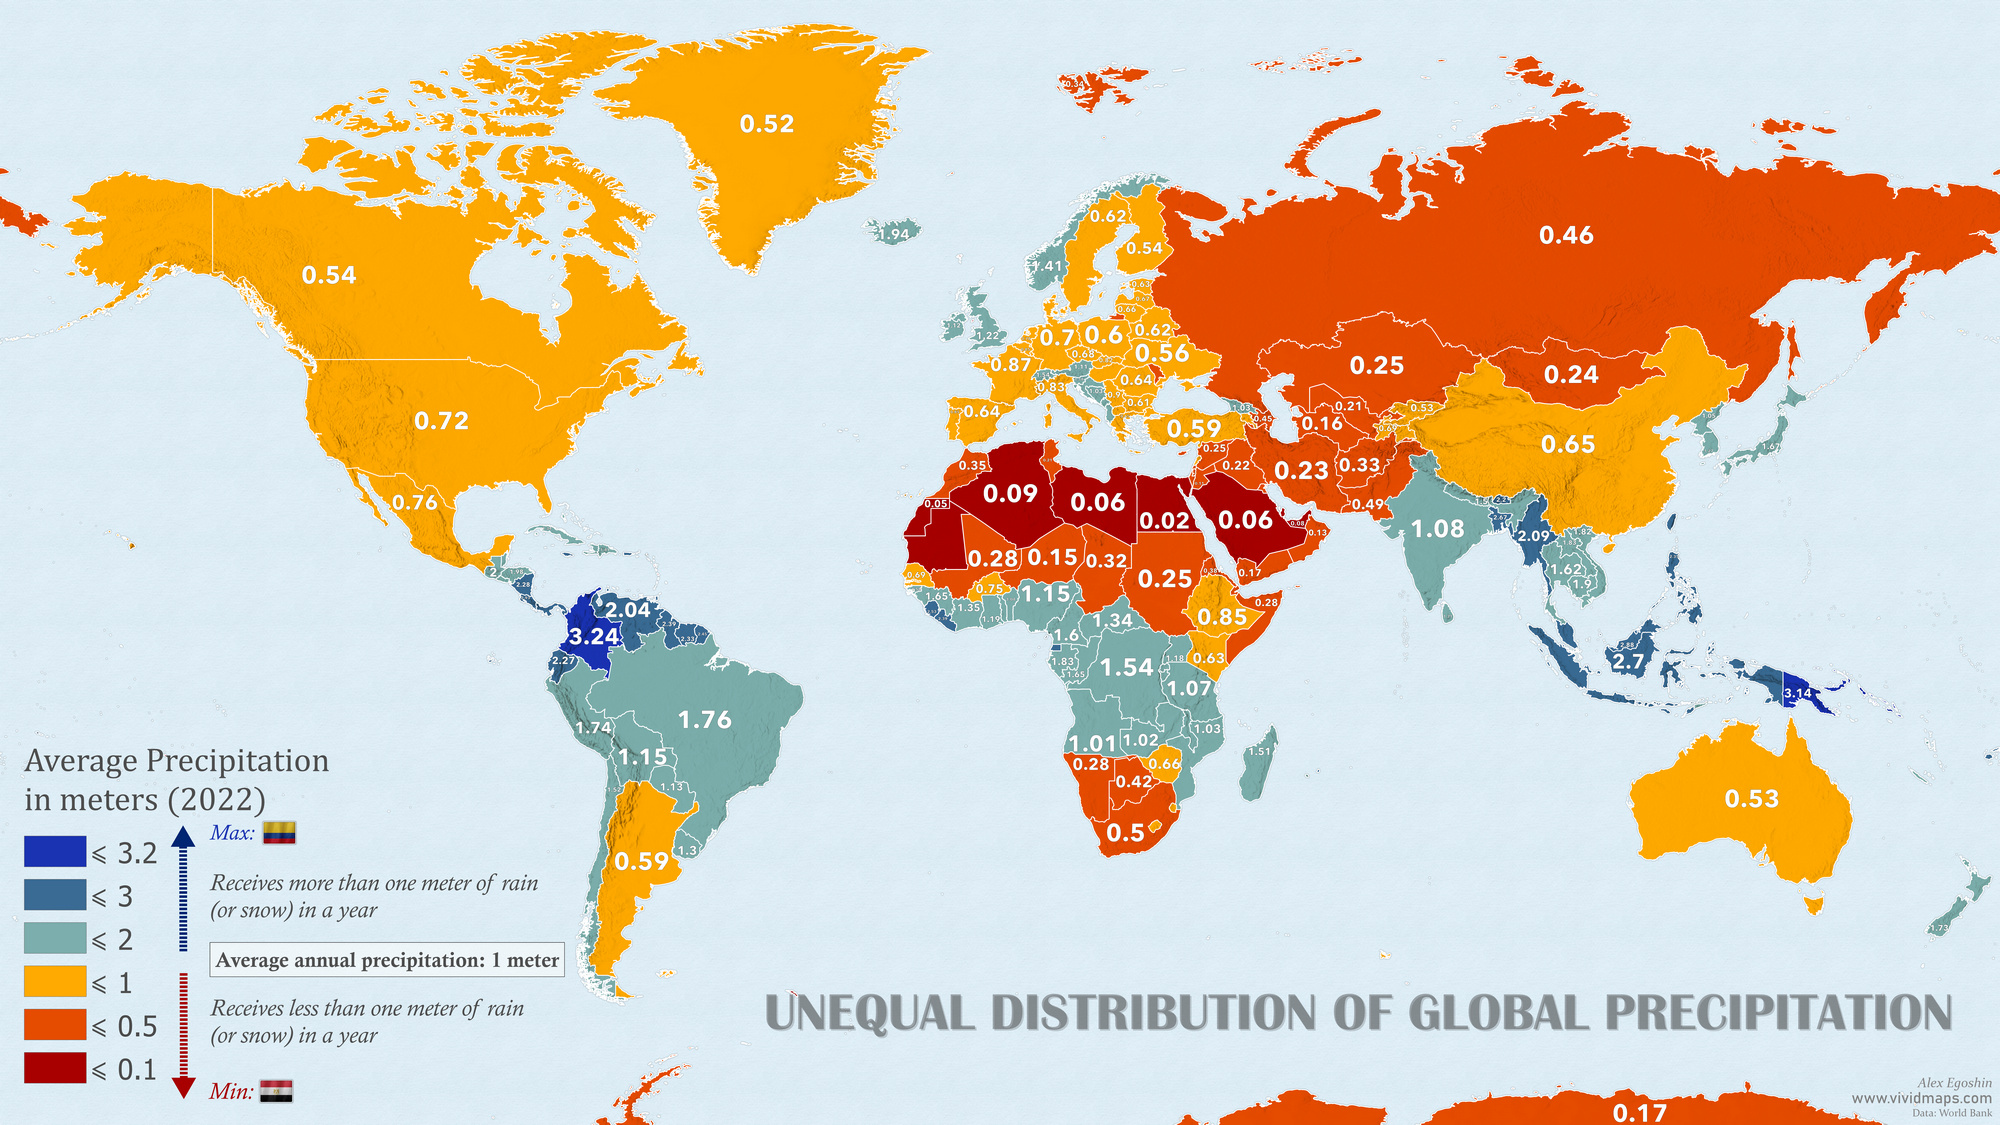
Countries Experiencing the Highest and Lowest Precipitation
Using 2020 World Bank data, I created the world map that shows the distribution of global precipitation by country. Colombia tops the list of rainiest nations—its equatorial location, coastal exposure, and mountain ranges create ideal conditions for high rainfall.
Top 10 Wettest Countries (mm/year)
Rank
Country
Average Precipitation, mm
1
Colombia
3,240
2
Sao Tome & Principe
3,200
3
Papua New Guinea
3,142
4
Solomon Islands
3,028
5
Panama
2,928
6
Costa Rica
2,926
7
Samoa
2,880
8
Malaysia
2,875
9
Brunei Darussalam
2,722
10
Indonesia
2,702
The driest nations are mostly in North Africa and the Arabian Peninsula, where persistent high-pressure systems, coastal cold currents, and rain shadow effects keep rainfall extremely scarce.
Top 10 Driest Countries (mm/year)
Rank
Country
Average Precipitation, mm
1
Egypt
18
2
Libya
56
3
Saudi Arabia
59
4
Qatar
74
5
UAE
78
6
Bahrain
83
7
Algeria
89
8
Mauritania
92
9
Jordan
111
10
Kuwait
121
You can learn more about the climate from the following map posters available on Amazon:


?")

