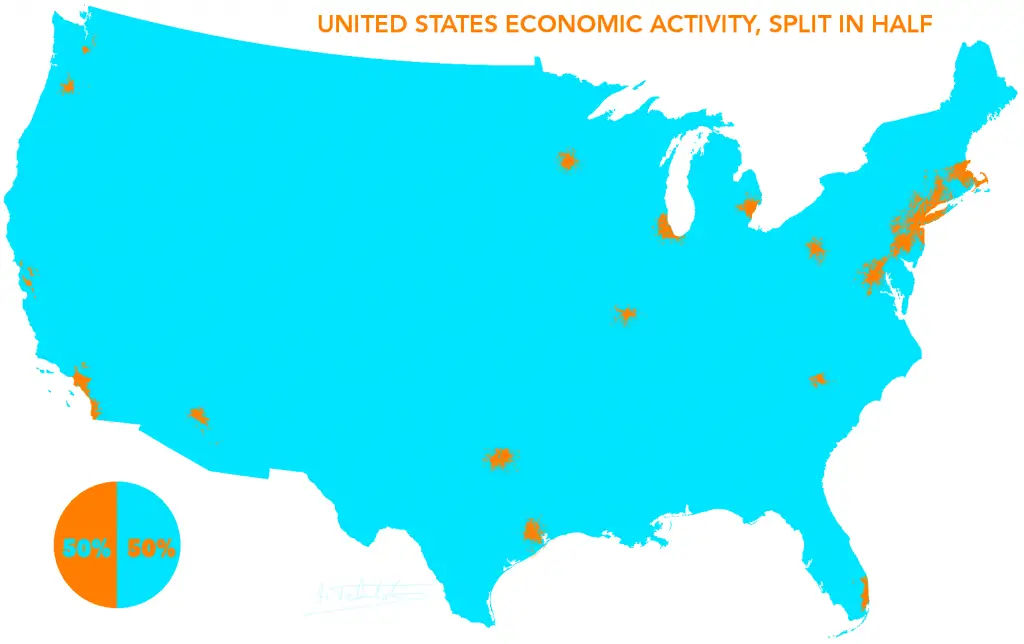
U.S. economic activity, split in half
The uneven spatial distribution of economic activity in the United States is a nuanced phenomenon shaped by a myriad of historical, geographical, and socio-economic factors. Coastal regions, particularly along the East and West Coasts, stand out as concentrated centers of economic vitality, hosting major metropolitan areas that serve as powerhouses for diverse industries. Cities like New York, San Francisco, and Boston have become synonymous with financial services, technological innovation, and cultural institutions, driving significant portions of the nation’s economic output.
However, this economic dynamism is juxtaposed against more challenged regions, such as parts of the Midwest and the Rust Belt, where the decline of traditional industries, manufacturing, and population loss has led to economic stagnation and structural challenges. Cities like Detroit, Cleveland, and certain rural areas have faced the repercussions of industrial decline, impacting employment opportunities and overall economic vibrancy.
The South, on the other hand, has experienced a more varied economic trajectory, with some metropolitan areas flourishing due to population growth, business-friendly environments, and strategic investments, while others grapple with persistent challenges, including poverty and lower educational attainment.
Natural resource-rich regions, like the Mountain West and certain parts of the South, contribute significantly to the economy through energy extraction and production, but these areas also experience economic volatility linked to commodity markets.
The map below shows the United States’ economic activity split in half.
The wealthiest metropolitan statistical areas in the United States
The wealthiest metropolitan statistical areas (MSAs) in the United States are characterized by robust economies, high-income residents, and diverse industries. Cities such as San Francisco, New York, Washington, D.C., and Boston stand out for their concentrations of technology, finance, government, and education sectors. These affluent MSAs often exhibit high levels of income per capita, luxury real estate markets, and a range of cultural and educational amenities, making them hubs of economic prosperity and attractive places for businesses and high-income individuals.
Nominal GDP for the top 10 metropolitan statistical areas in 2021
| Rank | City | GDP (in Millions of dollars) |
|---|---|---|
| 1 | New York-Newark-Jersey City | $1,992,779 |
| 2 | Los Angeles-Long Beach-Anaheim | $1,124,682 |
| 3 | Chicago-Naperville-Elgin | $764,583 |
| 4 | San Francisco-Oakland-Berkeley | $668,677 |
| 5 | Washington-Arlington-Alexandria | $607,628 |
| 6 | Dallas-Fort Worth-Arlington | $598,333 |
| 7 | Houston-The Woodlands-Sugar Land | $537,066 |
| 8 | Boston-Cambridge-Newton | $531,671 |
| 9 | Seattle-Tacoma-Bellevue | $479,966 |
| 10 | Philadelphia-Camden-Wilmington | $477,580 |
Top 10 metropolitan statistical areas with the highest GDP per capita in 2021
| Rank | City | GDP Per Capita |
|---|---|---|
| 1 | Midland, TX MSA | $228,069 |
| 2 | San Jose-Sunnyvale-Santa Clara, CA MSA | $210,235 |
| 3 | San Francisco-Oakland-Berkeley, CA MSA | $144,633 |
| 4 | Seattle-Tacoma-Bellevue, WA MSA | $119,646 |
| 5 | Trenton-Princeton, NJ MSA | $113,069 |
| 6 | Boston-Cambridge-Newton, MA-NH MSA | $108,506 |
| 7 | Bridgeport-Stamford-Norwalk, CT MSA | $102,890 |
| 8 | New York-Newark-Jersey City, NY-NJ-PA MSA | $100,806 |
| 9 | Boulder, CO MSA | $100,691 |
| 10 | Washington-Arlington-Alexandria, DC-VA-MD-WV MSA | $607,628 |
The wealthiest U.S. States
The wealthiest states in the United States are characterized by robust economies, high median incomes, and diverse industries. States such as California, New York, and Massachusetts are known for their thriving technology, finance, and healthcare sectors, contributing significantly to their economic prosperity. These states often feature affluent communities, high-quality infrastructure, and strong educational systems, attracting businesses and residents seeking economic opportunities and a high standard of living.
GDP for the 10 rechest U.S. states in 2022
| Rank | State | GDP (in Millions of dollars) | % of national |
|---|---|---|---|
| 1 | California | 3,598,103 | 14.49% |
| 2 | Texas | 2,355,960 | 8.55% |
| 3 | New York | 2,053,180 | 8.31% |
| 4 | Florida | 1,389,070 | 5.34% |
| 5 | Illinois | 1,033,310 | 4.13% |
| 6 | Pennsylvania | 923,089 | 3.72% |
| 7 | Ohio | 822,670 | 3.26% |
| 8 | Georgia | 755,698 | 3.00% |
| 9 | New Jersey | 745,422 | 2.98% |
| 10 | North Carolina | 730,072 | 2.84% |
Top 10 U.S. states with the highest GDP per capita
| Rank | State | GDP Per Capita |
|---|---|---|
| 1 | District of Columbia | $242,853 |
| 2 | New York | $104,344 |
| 3 | Massachusetts | $98,609 |
| 4 | North Dakota | $94,02 |
| 5 | Washington | $93,193 |
| 6 | California | $92,190 |
| 7 | Connecticut | $88,760 |
| 8 | Alaska | $86,722 |
| 9 | Delaware | $85,977 |
| 10 | Colorado | $82,954 |
States such as Mississippi, West Virginia, and Louisiana consistently rank among the poorest, grappling with factors such as a history of industrial decline, limited educational resources, and insufficient infrastructure.
The wealthiest U.S. counties
The wealthiest counties in the United States are often located in proximity to major metropolitan areas and are characterized by high median incomes, upscale residential communities, and thriving economic activity. Counties such as Loudoun in Virginia, Santa Clara in California, and Howard County in Maryland consistently rank among the wealthiest.
Below is the list of the wealthiest U.S. counties in 2020.
| Rank | County | State | Median Household Income |
|---|---|---|---|
| 1 | Loudoun | Virginia | $147,111 |
| 2 | Falls Church | Virginia | $146,922 |
| 3 | Santa Clara | California | $130,890 |
| 4 | San Mateo | California | $128,091 |
| 5 | Fairfax | Virginia | $127,866 |
| 6 | Howard | Maryland | $124,042 |
| 7 | Arlington | Virginia | $122,604 |
| 8 | Marin | California | $121,671 |
| 9 | Douglas | Colorado | $121,393 |
| 10 | Nassau | New York | $120,036 |
The uneven distribution of economic activity is not solely a regional phenomenon, but is often manifested within metropolitan areas, where economic disparities exist among neighborhoods and communities. Factors such as historical patterns of segregation, access to quality education, and housing policies contribute to these intra-urban disparities.


Can someone explain the county in Washington state? That is so far out of what I would have assumed.
The north is Seattle, Washington, and the south is Portland, Oregon.