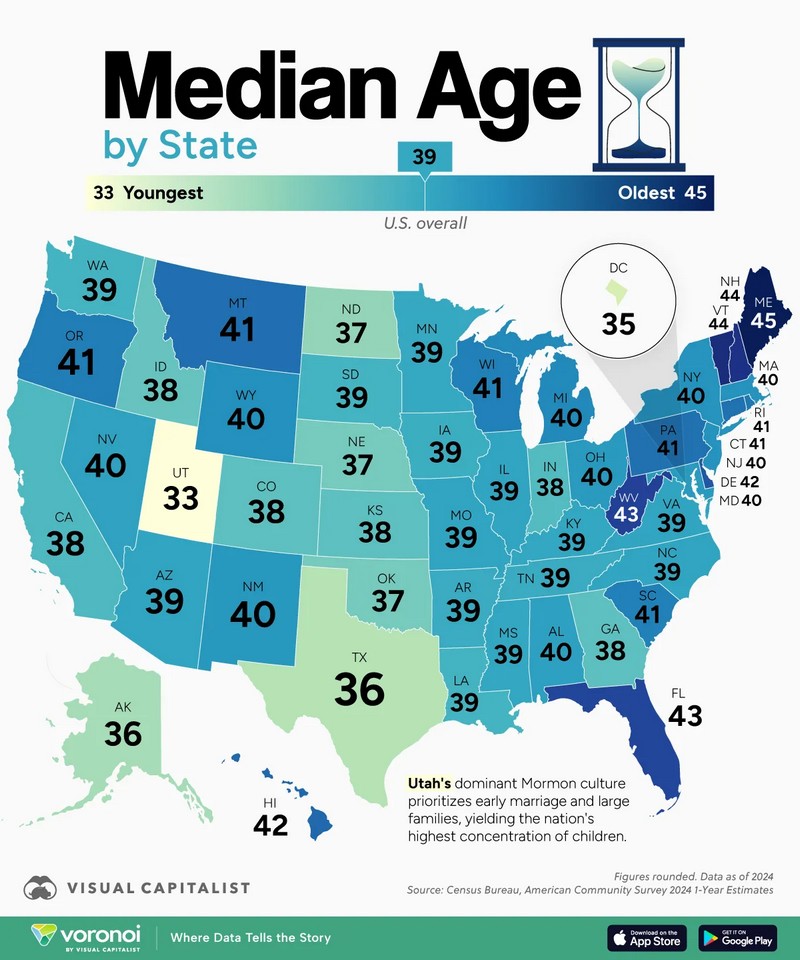
Maine leads at 44.9 years. Utah sits at 32.5 years. Between them lies 12 years, roughly a generation.
Vermont comes in at 43.9, New Hampshire at 43.6. Young New Englanders have been leaving for decades, drawn to job markets in other regions. West Virginia reaches 42.9, driven by a coal economy that’s been shedding workers since the 1980s rather than an influx of retirees. Florida is fifth at 42.7. Plenty of retirees move there, but Tampa and Miami also draw younger workers.
Utah’s lower number comes from higher birth rates that have persisted for years. D.C. follows at 34.9, Texas at 35.9, Alaska at 36.3. Most of the Mountain West and Plains lean younger. You’ll find North Dakota at 36.7, Idaho at 37.8, Colorado at 38.0.
Rank
State
Median Age 2024
Median Age 2000
Change 2000-2024
1
Maine
44.9
38.6
+6.3
2
Vermont
43.9
37.7
+6.2
3
New Hampshire
43.6
37.1
+6.5
4
West Virginia
42.9
38.9
+4.0
5
Florida
42.7
39.4
+3.3
6
Delaware
42.1
36.0
+6.1
7
Hawaii
41.5
36.2
+5.3
8
Montana
41.3
37.5
+3.8
9
Connecticut
41.2
37.4
+3.8
10
Pennsylvania
41.2
38.0
+3.2
11
Rhode Island
41.0
36.7
+4.3
12
Oregon
40.8
36.3
+4.5
13
South Carolina
40.7
35.4
+5.3
14
Wisconsin
40.7
36.0
+4.7
15
Michigan
40.4
35.5
+4.9
16
Wyoming
40.2
36.2
+4.0
17
Massachusetts
40.1
36.5
+3.6
18
New Jersey
40.1
36.7
+3.4
19
New York
40.1
35.9
+4.2
20
New Mexico
39.9
34.6
+5.3
21
Maryland
39.8
36.0
+3.8
22
Ohio
39.8
36.2
+3.6
23
Alabama
39.6
35.8
+3.8
24
Nevada
39.5
35.0
+4.5
25
Arizona
39.4
34.2
+5.2
26
Illinois
39.4
34.7
+4.7
27
Missouri
39.4
36.1
+3.3
28
North Carolina
39.4
35.3
+4.1
29
Virginia
39.4
35.7
+3.7
30
Kentucky
39.3
35.9
+3.4
31
Mississippi
39.3
33.8
+5.5
32
Minnesota
39.2
35.4
+3.8
33
Arkansas
39.1
36.0
+3.1
34
Tennessee
39.1
35.9
+3.2
35
Iowa
39.0
36.6
+2.4
36
Louisiana
38.7
34.0
+4.7
37
South Dakota
38.7
35.6
+3.1
38
Washington
38.7
35.3
+3.4
39
California
38.4
33.3
+5.1
40
Indiana
38.3
35.2
+3.1
41
Colorado
38.0
34.3
+3.7
42
Georgia
38.0
33.4
+4.6
43
Kansas
38.0
35.2
+2.8
44
Idaho
37.8
33.2
+4.6
45
Nebraska
37.4
35.3
+2.1
46
Oklahoma
37.4
35.5
+1.9
47
North Dakota
36.7
36.2
+0.5
48
Alaska
36.3
32.4
+3.9
49
Texas
35.9
32.3
+3.6
50
District of Columbia
34.9
34.6
+0.3
51
Utah
32.5
27.1
+5.4
—
U.S. Median Age
39.2
35.3
+3.9
How much each state has aged since 2000 also shows sharp contrasts. I compared the current numbers with Census 2000 data.
New Hampshire was at 37.1 in 2000. Now it’s 43.6. Vermont went from 37.7 to 43.9. Maine from 38.6 to 44.9. Delaware from 36.0 to 42.1. New England shows the steepest climbs, with most states adding over 6 years.
North Dakota was at 36.2 in 2000. Today it’s 36.7. Half a year in nearly a quarter century. D.C. went from 34.6 to 34.9. Oklahoma from 35.5 to 37.4. Nebraska from 35.3 to 37.4. Nationally, the median climbed 3.9 years, so these states aged at roughly one-eighth that rate.
Migration is the main driver. Starting in the 1980s, twentysomethings began leaving the Northeast and Midwest after manufacturing jobs dried up. They headed to growing Sun Belt cities. That pattern hasn’t reversed. States that kept attracting younger workers aged much more slowly.
Birth rates also play a role. Pew’s research shows Hispanic families average more children than non-Hispanic white families. Asian populations continue growing primarily through immigration. Maine and Vermont are both over 90% non-Hispanic white, which means they miss out on the demographic offset that higher birth rates provide in states like Texas or California.
Aging tends to compound. When young adults leave an area, fewer babies get born. A generation later, there are even fewer young adults. Meanwhile, states that attract people in their 20s and 30s maintain younger populations, which makes them more appealing to other young people.
Vermont’s median age now exceeds Utah’s by 12 years. Vermont shuts down schools. Utah builds them. Hospital capacity needs diverge. Workforce pools look completely different. This demographic gap will shape state operations for decades.