Coffea arabica is native to the highland forests of Ethiopia’s Kaffa region, likely the source of the word coffee itself. Legend credits a goatherd named Kaldi with discovering the plant, sometime around 850 CE, after his goats grew unusually energetic from eating its berries. That account was not written down until 1671, so it belongs more to folklore than documented history. What is confirmed is that by the 15th century, coffee was cultivated and brewed as a beverage in Yemen, where Sufi mystics used it to stay alert through nighttime prayer.
Coffeehouses spread through Mecca, Cairo, and Constantinople over the following two centuries, then reached Europe by the 1600s, where they became gathering places for merchants, writers, and early scientists. European colonial powers carried cultivation far beyond Yemen, first to Java under the Dutch and later across the Americas, until Brazil emerged as the world’s dominant producer by the 20th century.
I created the maps below using FAOSTAT Food Balance Sheets, which cover 175 countries between 2010 and 2023. FAO records coffee using primary equivalent weights, and for coffee that primary product is green coffee, meaning dried, cleaned beans before roasting. Instant, roasted, and ready to drink coffee are all folded back into this green bean equivalent for comparison across countries.
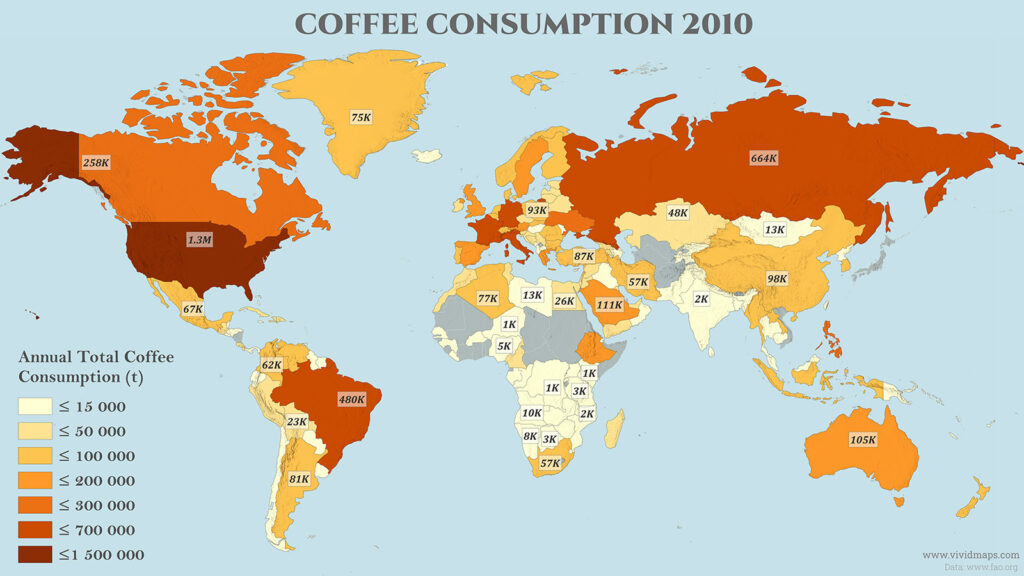
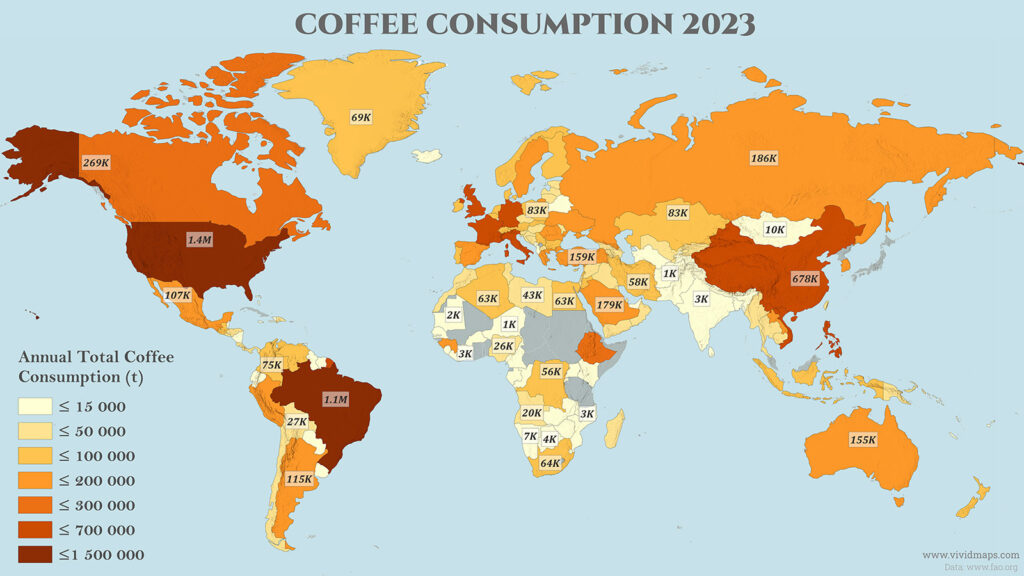
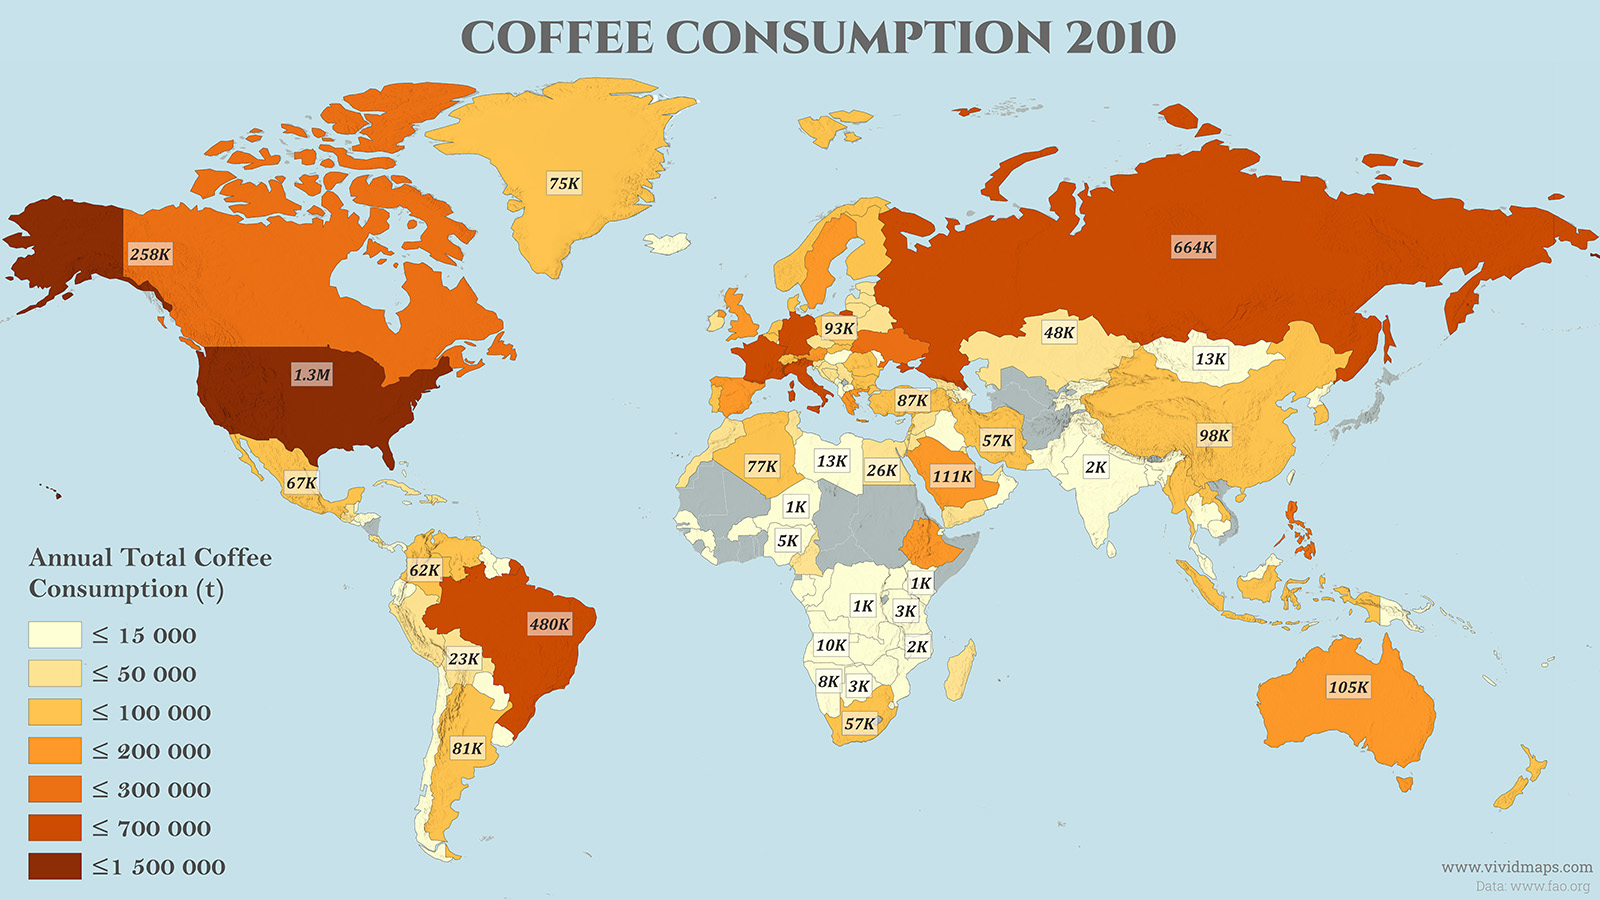
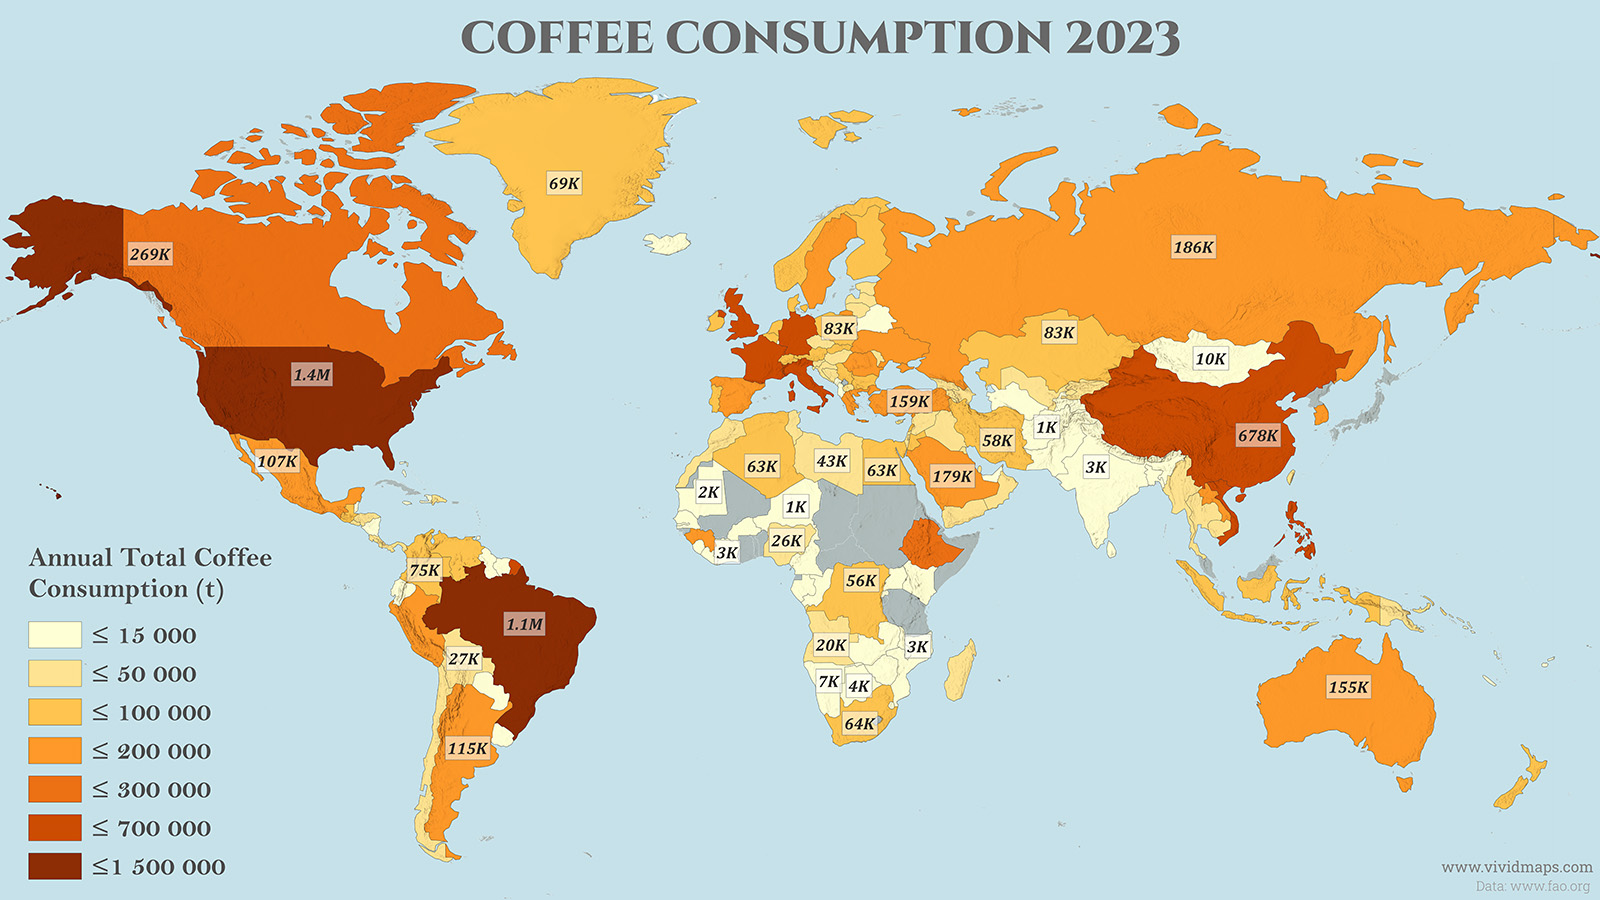
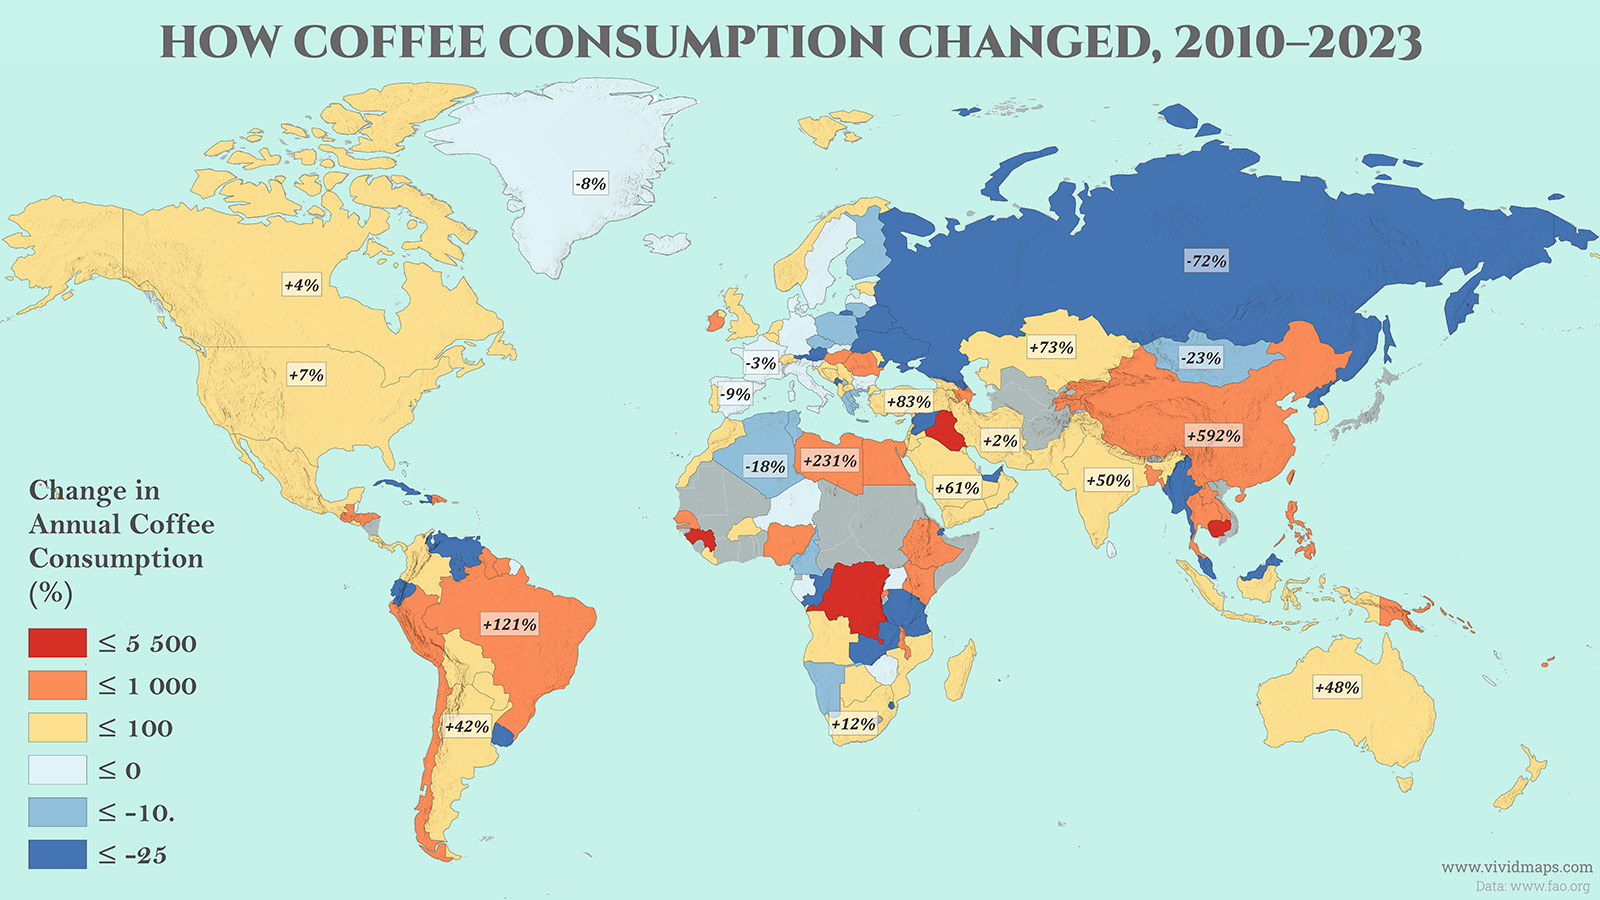
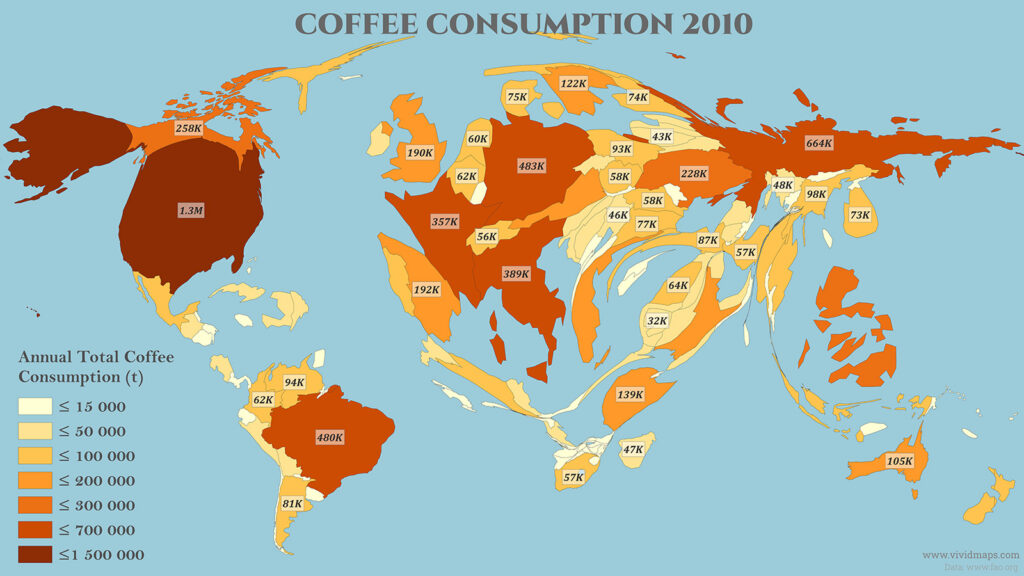
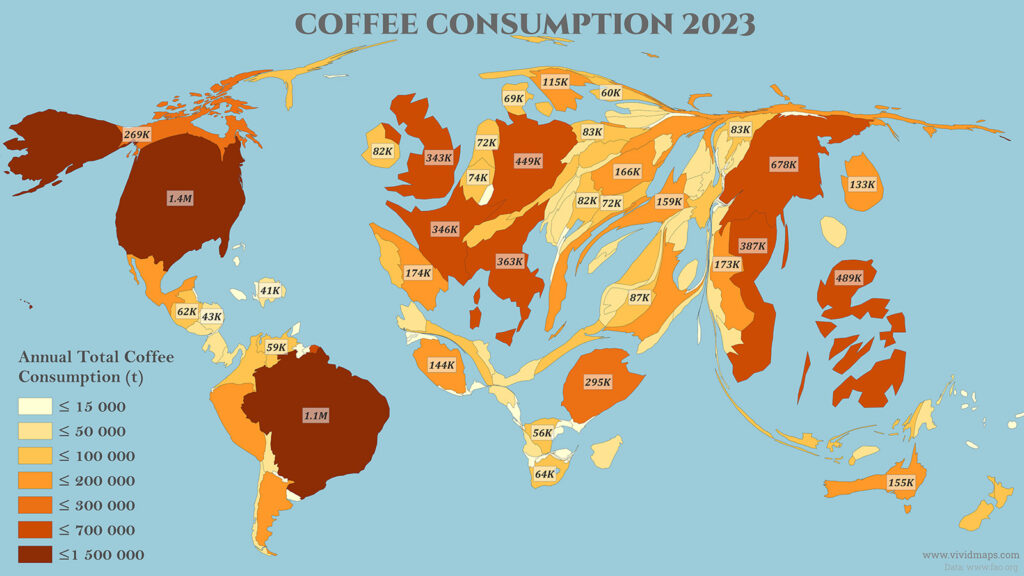
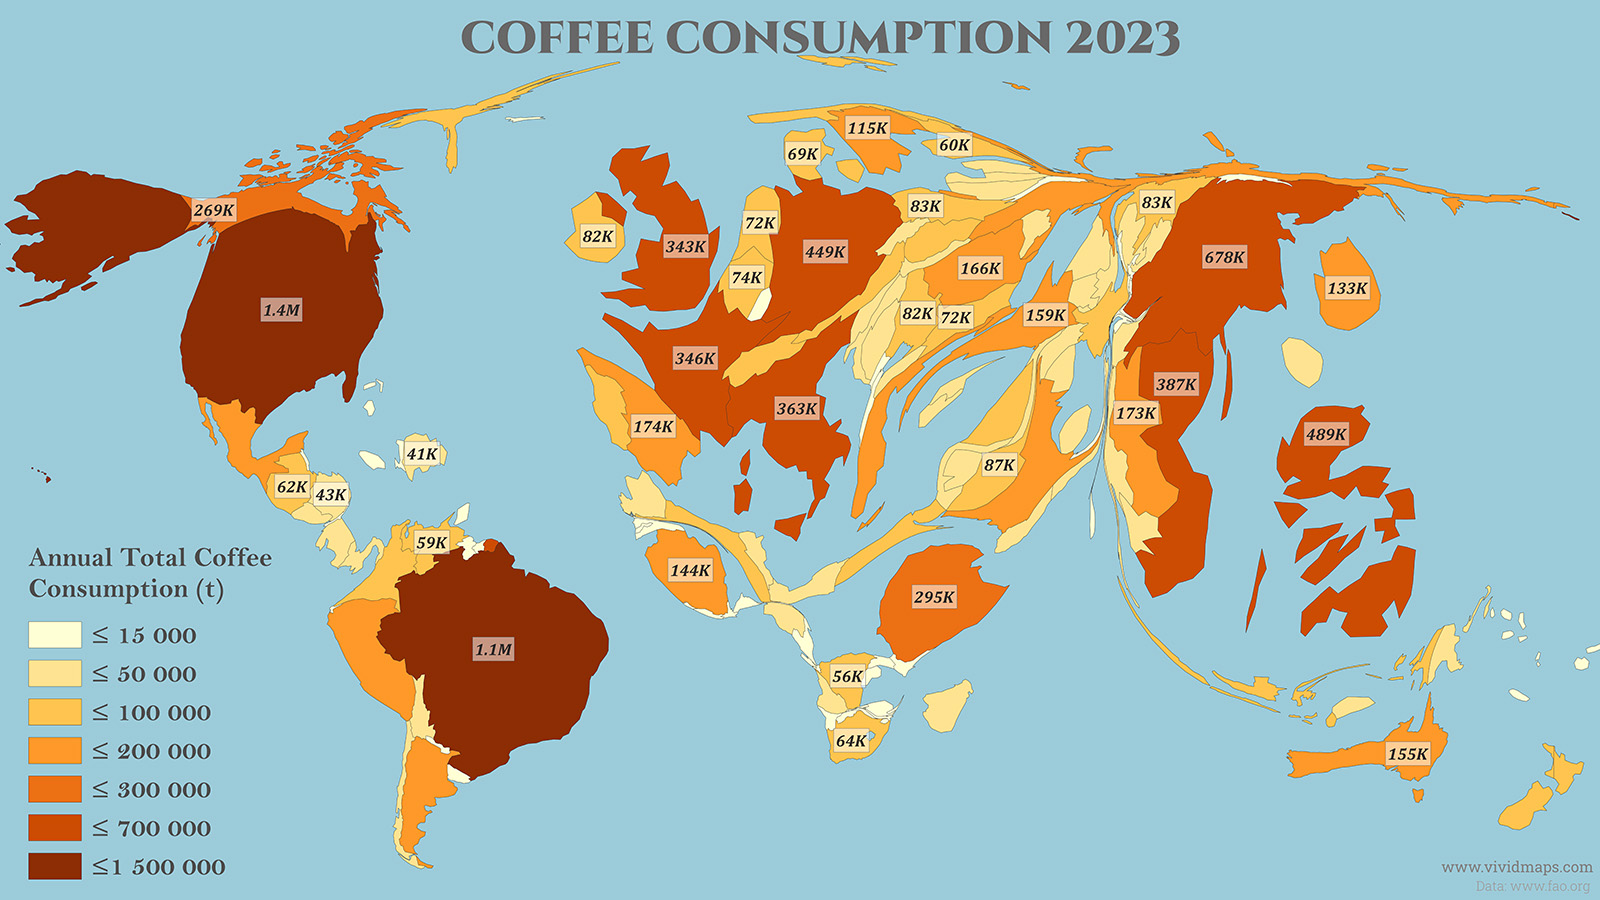
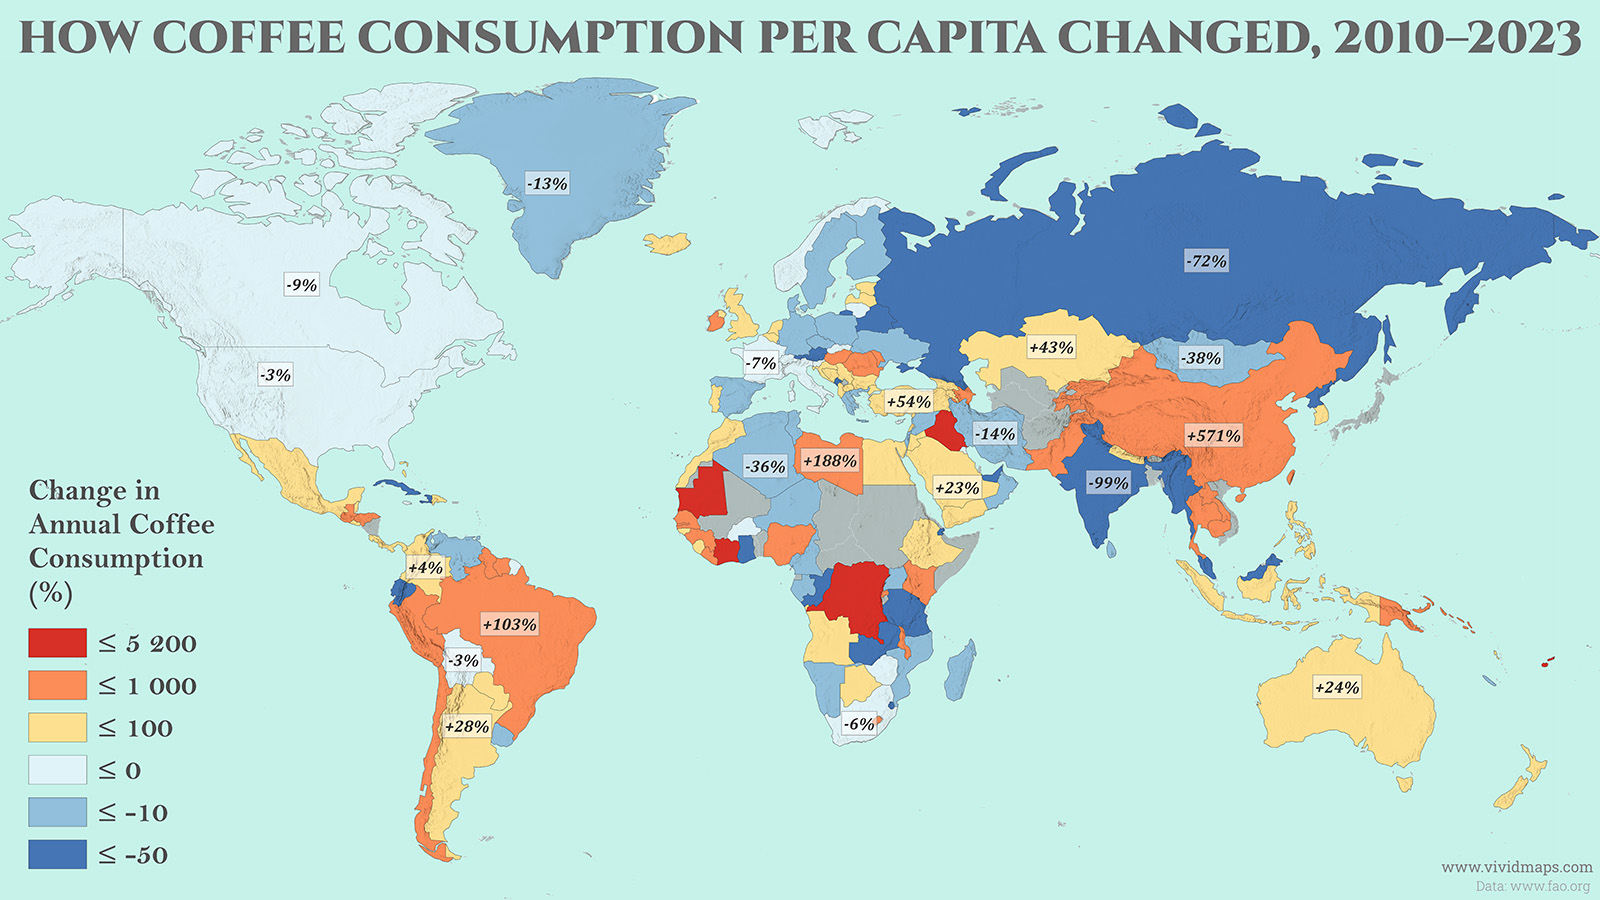
Global coffee supply grew from 8,612 thousand tonnes in 2010 to 11,576 thousand tonnes in 2023, a rise of about 34 percent, a far gentler curve than tea followed over the same years. The United States remained the largest market throughout, growing modestly from 1,338 to 1,431 thousand tonnes. Brazil, already the world’s top coffee producer, more than doubled its own supply from 480 to 1,061 thousand tonnes. China’s coffee market grew faster than any other large country, from 98 to 678 thousand tonnes, as coffee chains multiplied across its cities. The Philippines climbed from 236 to 489 thousand tonnes, and the United Kingdom grew from 190 to 343 thousand tonnes.
A number of established European markets moved the other direction. Germany dropped from 483 to 449 thousand tonnes. Italy fell from 389 to 363 thousand tonnes, and France from 357 to 346 thousand tonnes. Russia’s supply fell from 664 to 186 thousand tonnes, a decline the data most likely overstates in scale, though the underlying direction lines up with real disruption to Russian coffee imports following 2022.
Country
2010 (1,000 t)
2023 (1,000 t)
Change
United States
1,338
1,431
7.00%
Brazil
480
1,061
121.00%
China
98
678
591.80%
Philippines
236
489
107.20%
Germany
483
449
−7.0%
Vietnam
0
387
N/A
Italy
389
363
−6.7%
France
357
346
−3.1%
United Kingdom
190
343
80.50%
Ethiopia
139
295
112.20%
Canada
258
269
4.30%
Russia
664
186
−72.0%
Saudi Arabia
111
179
61.30%
Spain
192
174
−9.4%
Laos
66
173
162.10%
Peru
32
172
437.50%
Romania
58
166
186.20%
Türkiye
87
159
82.80%
Australia
105
155
47.60%
Guinea
11
144
1209.10%
South Korea
73
133
82.20%
Argentina
81
115
42.00%
Sweden
122
115
−5.7%
Mexico
67
107
59.70%
Ukraine
228
106
−53.5%
Greece
131
102
−22.1%
Jordan
46
87
89.10%
Kazakhstan
48
83
72.90%
Poland
93
83
−10.8%
Ireland
27
82
203.70%
Serbia
46
82
78.30%
Indonesia
64
78
21.90%
Colombia
62
75
21.00%
Lebanon
64
75
17.20%
Belgium
62
74
19.40%
Bulgaria
77
72
−6.5%
Netherlands
60
72
20.00%
Denmark
75
69
−8.0%
New Zealand
51
66
29.40%
South Africa
57
64
12.30%
Algeria
77
63
−18.2%
Egypt
26
63
142.30%
Guatemala
21
62
195.20%
Finland
74
60
−18.9%
Venezuela
94
59
−37.2%
Iran
57
58
1.80%
Norway
57
58
1.80%
Portugal
55
58
5.50%
Slovakia
58
58
0.00%
Switzerland
56
57
1.80%
Austria
104
56
−46.2%
DR Congo
1
56
5500.00%
Thailand
13
50
284.60%
Georgia
29
48
65.50%
Madagascar
47
48
2.10%
Bosnia and Herzegovina
38
45
18.40%
Morocco
29
45
55.20%
Honduras
7
43
514.30%
Libya
13
43
230.80%
Dominican Republic
20
41
105.00%
Lithuania
43
38
−11.6%
Papua New Guinea
5
37
640.00%
Croatia
33
36
9.10%
Cambodia
3
35
1066.70%
Uzbekistan
0
34
N/A
Israel
32
33
3.10%
Costa Rica
20
31
55.00%
Iraq
1
30
2900.00%
Qatar
0
29
N/A
Yemen
19
29
52.60%
Chile
10
28
180.00%
Kuwait
18
28
55.60%
Bolivia
23
27
17.40%
Myanmar
62
27
−56.5%
Nigeria
5
26
420.00%
Moldova
15
25
66.70%
Armenia
16
24
50.00%
Kyrgyzstan
9
23
155.60%
Latvia
23
23
0.00%
Tunisia
26
23
−11.5%
Azerbaijan
10
22
120.00%
Slovenia
24
22
−8.3%
Czechia
24
21
−12.5%
Estonia
18
21
16.70%
Syria
32
21
−34.4%
Angola
10
20
100.00%
Panama
10
20
100.00%
Hungary
6
19
216.70%
North Macedonia
14
19
35.70%
Oman
12
19
58.30%
Timor-Leste
13
17
30.80%
Cyprus
14
16
14.30%
El Salvador
13
16
23.10%
Senegal
3
14
366.70%
Cameroon
16
13
−18.8%
Luxembourg
14
13
−7.1%
Belarus
31
12
−61.3%
Maldives
8
11
37.50%
Albania
9
10
11.10%
Bahrain
0
10
N/A
Kenya
1
10
900.00%
Malawi
3
10
233.30%
World total
8,612
11,576
34.40%
Coffee Consumption by Country (Cartogram): 2010 vs 2023
Per Capita Consumption
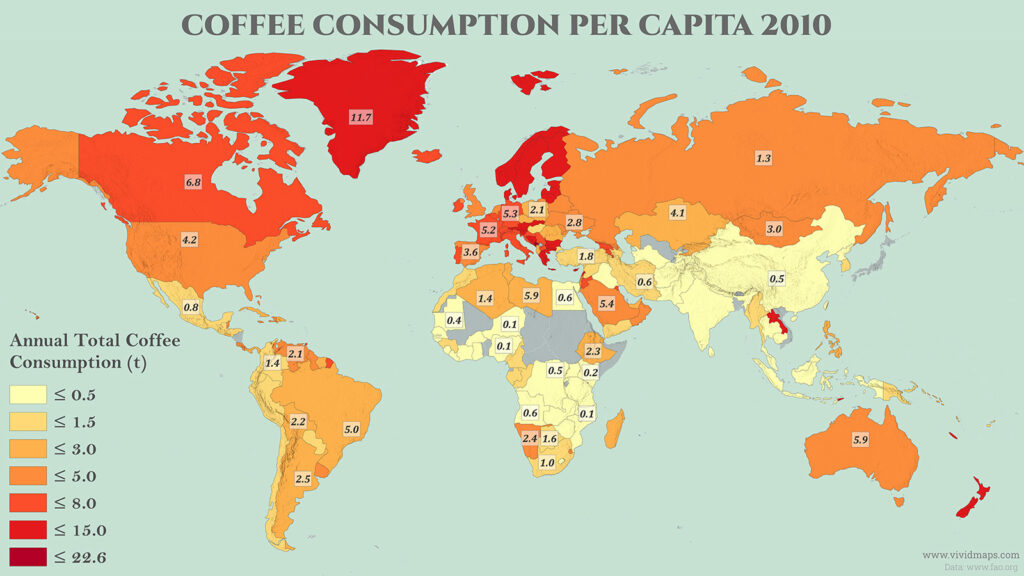
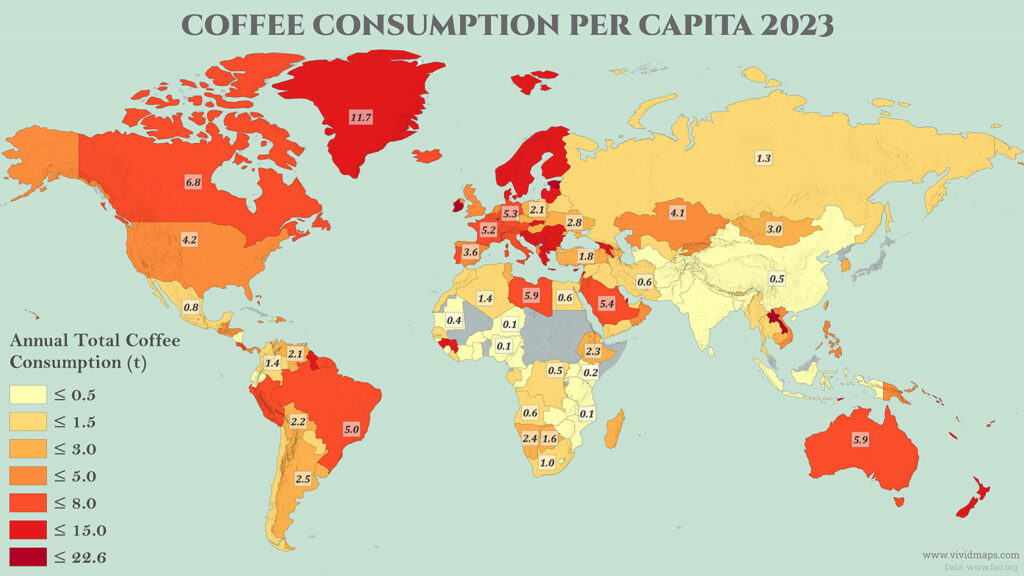
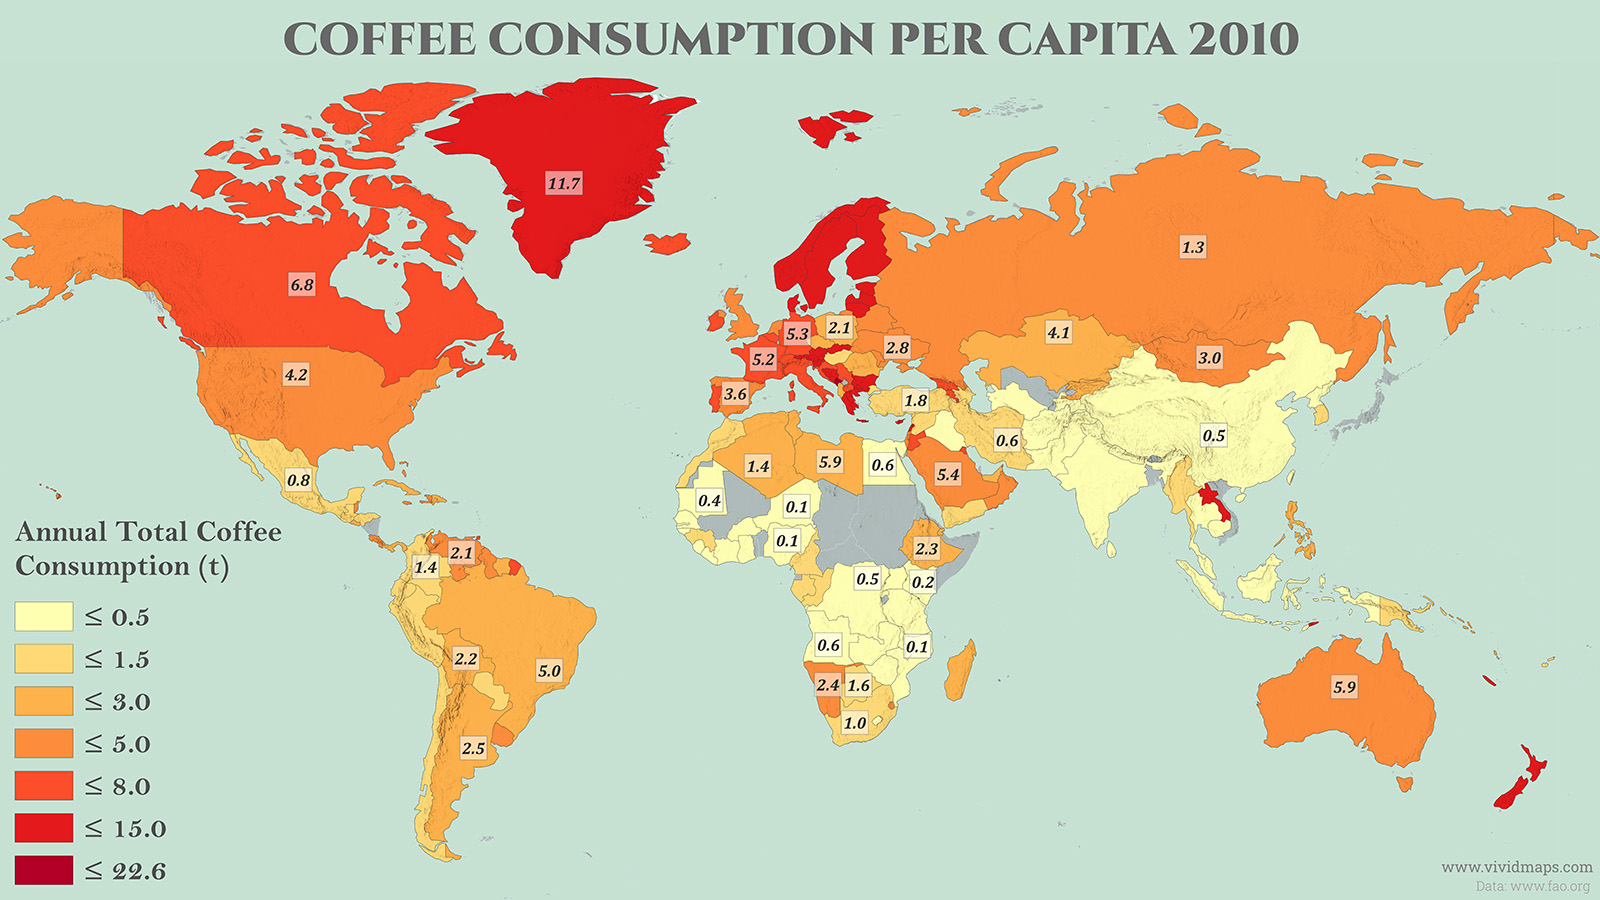
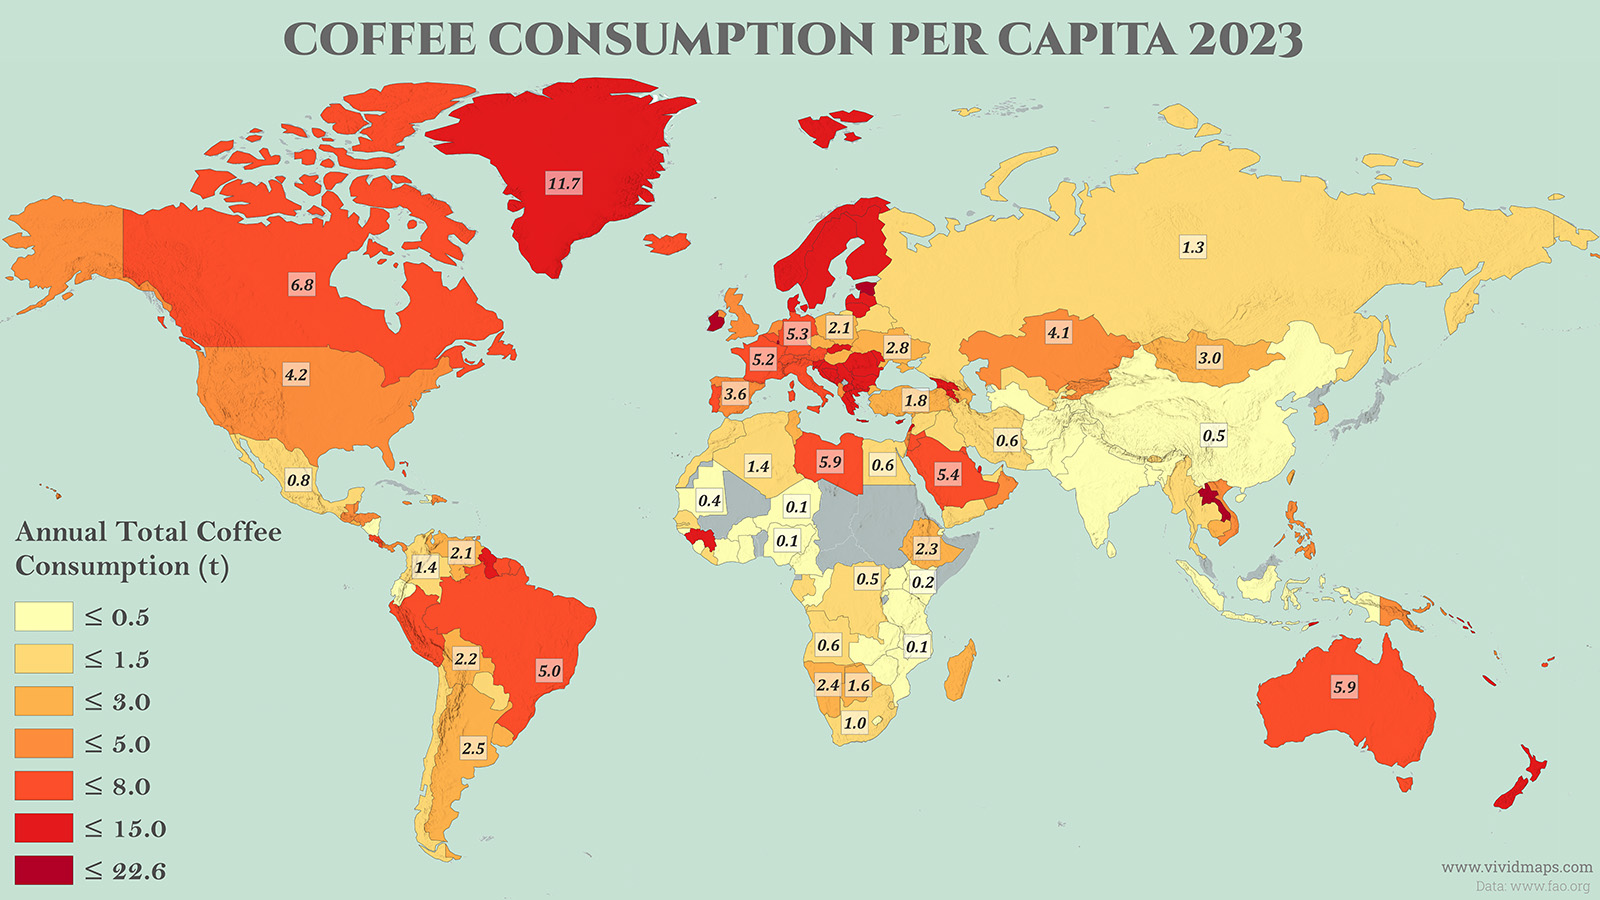
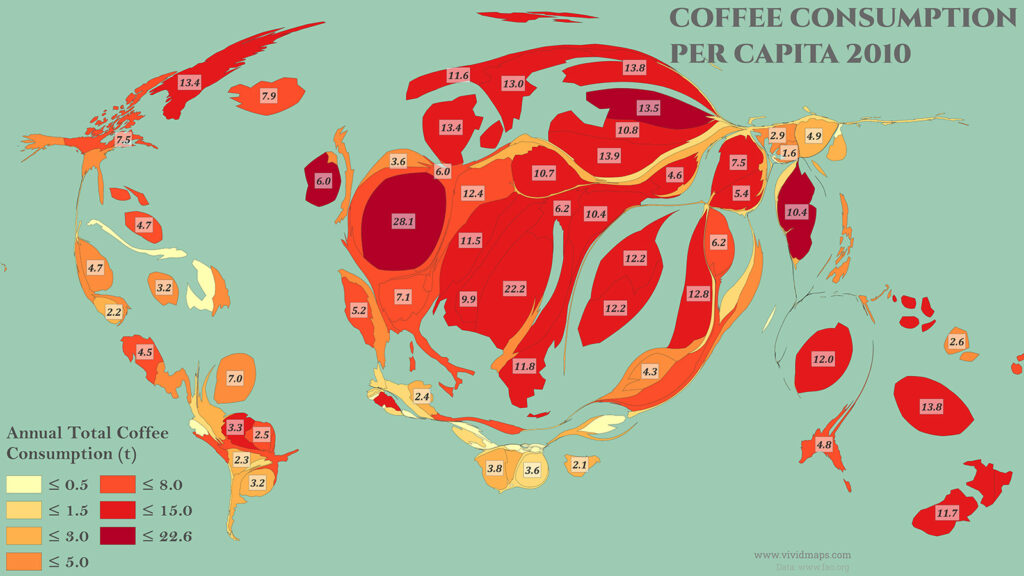
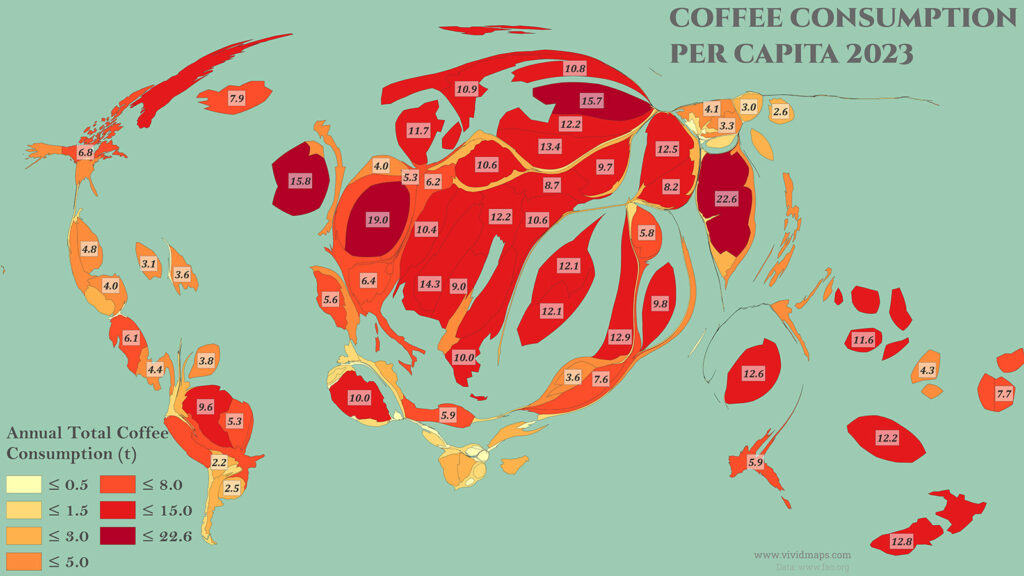
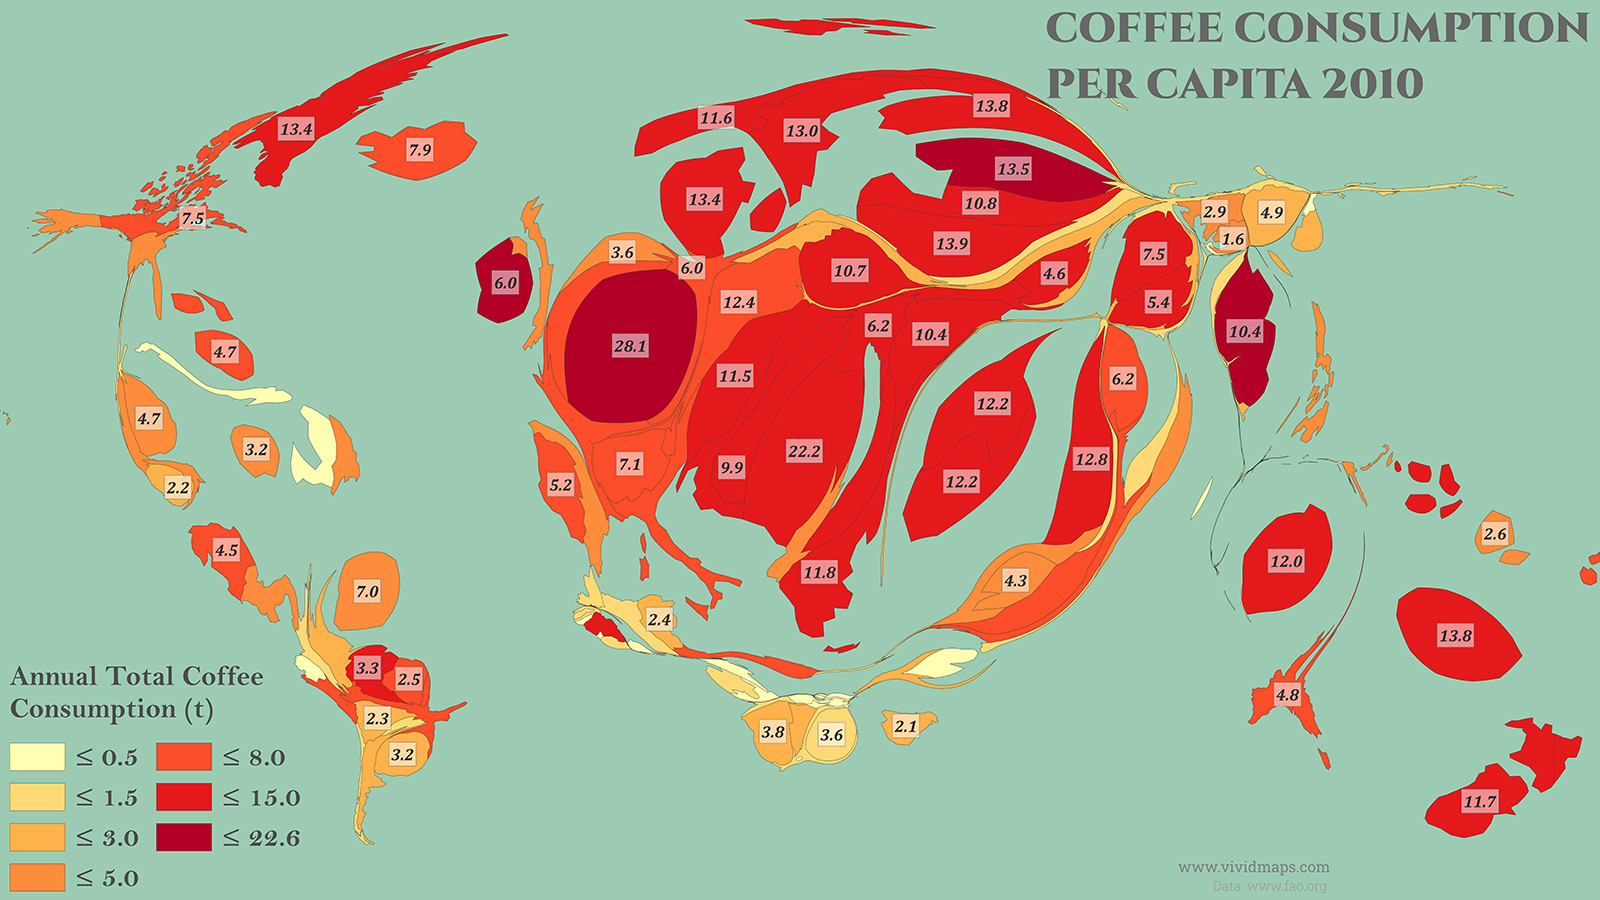
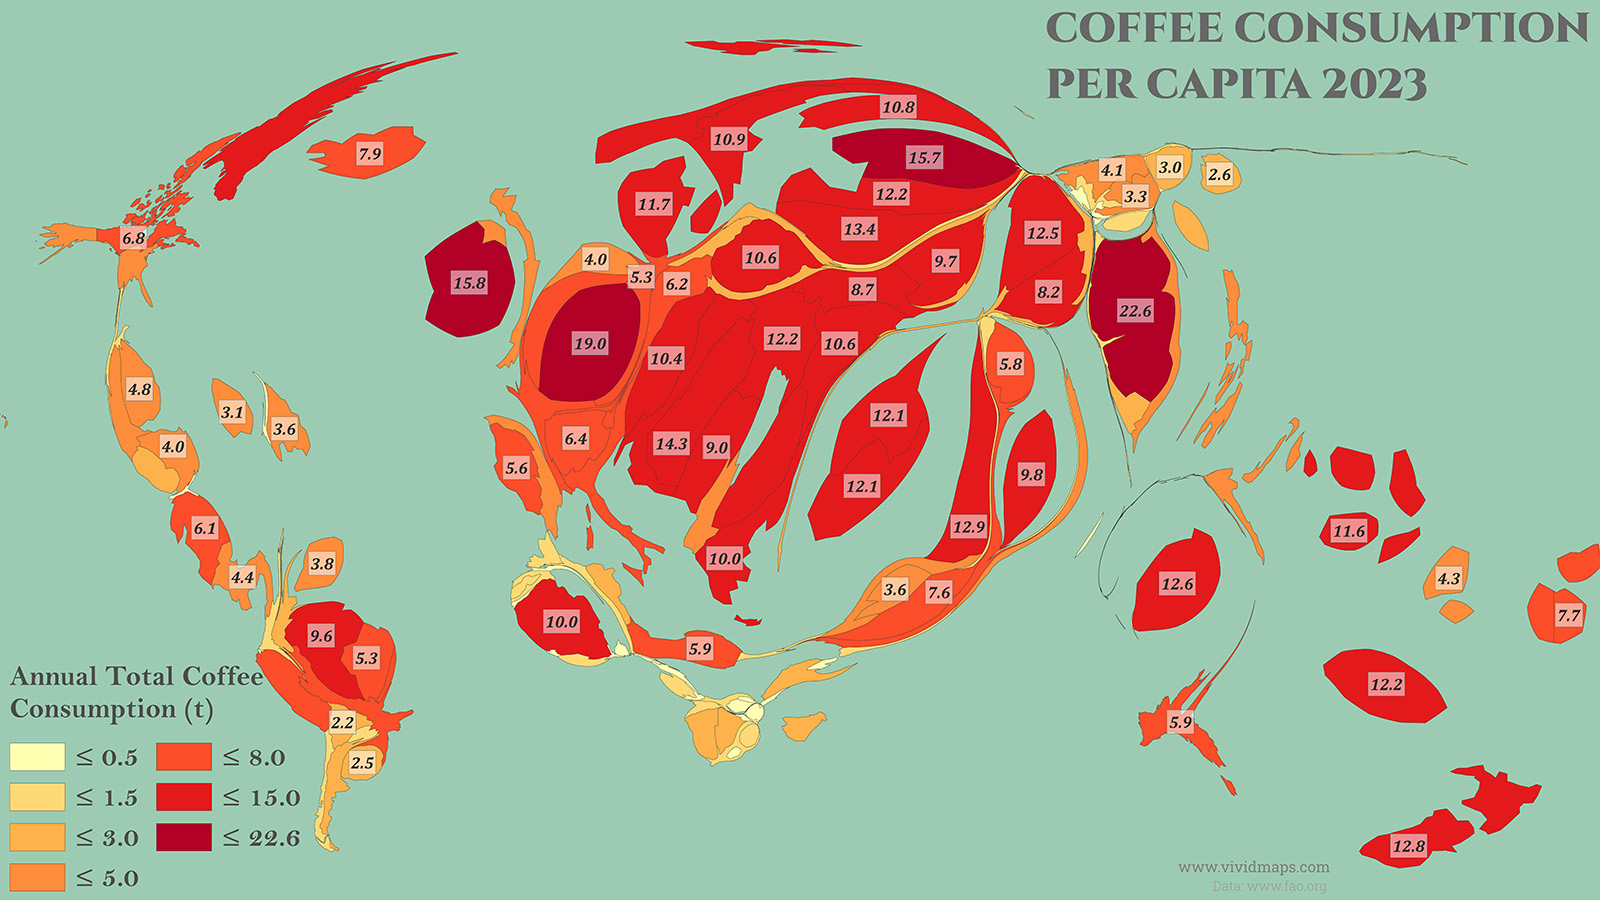
Per person, the map looks different again. Laos supplies more coffee per resident than almost anywhere else, 22.59 kg (49.8 lbs) in 2023, up from 10.37 kg (22.9 lbs) in 2010. The Maldives holds a similarly high figure, 20.72 kg (45.7 lbs), largely reflecting its small population and an import-dependent, tourism-heavy economy. Ireland’s per capita figure nearly tripled, from 5.98 kg (13.2 lbs) to 15.79 kg (34.8 lbs), part of the same shift toward coffee that has been eating into the country’s tea habit. The United States, the largest market by total volume, actually declined slightly per person, from 4.30 kg (9.5 lbs) to 4.17 kg (9.2 lbs), even as its total supply grew. Türkiye’s per capita figure rose from 1.18 kg (2.6 lbs) to 1.82 kg (4.0 lbs), a much smaller shift than the country’s leap in tea drinking over the same period.
Coffee Consumption per capita by country: 2010 vs 2023
Country
2010 (kg/cap)
2023 (kg/cap)
Change
Marshall Islands
0
23.26
N/A
Laos
10.37
22.59
117.80%
Maldives
20.93
20.72
−1.0%
Luxembourg
28.12
18.98
−32.5%
Ireland
5.98
15.79
164.00%
Estonia
13.46
15.68
16.50%
Antigua and Barbuda
1.81
14.44
697.80%
Bosnia and Herzegovina
9.93
14.26
43.60%
Lithuania
13.92
13.4
−3.7%
Lebanon
12.76
12.91
1.20%
New Zealand
11.74
12.81
9.10%
Timor-Leste
12.03
12.58
4.60%
Georgia
7.5
12.52
66.90%
Latvia
10.85
12.17
12.20%
Serbia
6.24
12.15
94.70%
Cyprus
12.22
12.05
−1.4%
Denmark
13.43
11.68
−13.0%
Solomon Islands*
2.51
11.59
361.80%
Malta
13.33
10.96
−17.8%
Sweden
12.96
10.9
−15.9%
Finland
13.78
10.76
−21.9%
Bulgaria
10.37
10.63
2.50%
Norway
11.56
10.58
−8.5%
Slovakia
10.66
10.57
−0.8%
Barbados
7.08
10.55
49.00%
Slovenia
11.5
10.43
−9.3%
North Macedonia
6.58
10.13
54.00%
Guinea
1.03
9.97
868.00%
Greece
11.76
9.96
−15.3%
Qatar
0
9.8
N/A
Moldova
4.64
9.69
108.80%
Guyana
3.31
9.61
190.30%
Croatia
7.58
9.16
20.80%
Montenegro
22.25
9.02
−59.5%
Romania
2.82
8.68
207.80%
Armenia
5.41
8.25
52.50%
Iceland
7.89
7.93
0.50%
Fiji
0.57
7.73
1256.10%
Seychelles
1.37
7.73
464.20%
Jordan
6.37
7.57
18.80%
Canada
7.54
6.84
−9.3%
Bahrain
0
6.66
N/A
Switzerland
7.1
6.43
−9.4%
Belgium
5.68
6.3
10.90%
Austria
12.41
6.18
−50.2%
Bahamas
4.72
6.15
30.30%
Italy
6.46
6.11
−5.4%
Costa Rica
4.47
6.1
36.50%
Libya
2.06
5.94
188.30%
Australia
4.75
5.88
23.80%
Kuwait
6.15
5.81
−5.5%
Portugal
5.22
5.6
7.30%
Saudi Arabia
4.39
5.39
22.80%
Peru
1.11
5.09
358.60%
Brazil
2.48
5.03
102.80%
United Kingdom
3.02
4.99
65.20%
Panama
2.87
4.41
53.70%
Mauritius
2.71
4.4
62.40%
Vanuatu
2.59
4.35
68.00%
Philippines
2.45
4.26
73.90%
United States
4.3
4.17
−3.0%
Kazakhstan
2.86
4.1
43.40%
Honduras
0.86
4.05
370.90%
Netherlands
3.57
3.99
11.80%
Vietnam
0
3.86
N/A
Oman
4.24
3.8
−10.4%
Spain
4.1
3.64
−11.2%
Papua New Guinea
0.61
3.59
488.50%
Guatemala
1.44
3.43
138.20%
Kyrgyzstan
1.55
3.31
113.50%
South Korea
1.49
2.58
73.20%
Argentina
1.96
2.51
28.10%
El Salvador
2.19
2.5
14.20%
Ethiopia
1.54
2.3
49.40%
Bolivia
2.29
2.22
−3.1%
Azerbaijan
1.04
2.15
106.70%
Poland
2.43
2.13
−12.3%
Venezuela
3.25
2.09
−35.7%
Cambodia
0.2
2.03
915.00%
Coffee Consumption per capita by country (Cartogram): 2010 vs 2023
Much of China’s coffee boom traces to one company’s rapid expansion. Luckin Coffee grew from a single store in 2017 to more than 10,000 locations by mid-2023, overtaking Starbucks in Chinese sales that same year. Overall coffee consumption in China rose 15 percent in 2023 alone. Vietnam’s growth follows a related but distinct path. Already the world’s second largest coffee producer, the country has increasingly kept more of its own crop at home as urbanization and a growing middle class have built a genuine domestic cafe culture. The United Kingdom’s rise fits into a broader shift already visible in the tea data. A 2023 consumer survey found more Britons now drink coffee regularly than tea for the first time on record. Germany, Italy, and France, all mature markets with coffee cultures far older than China’s or Vietnam’s, moved only slightly, the kind of small decline typical of a market with little room left to grow.