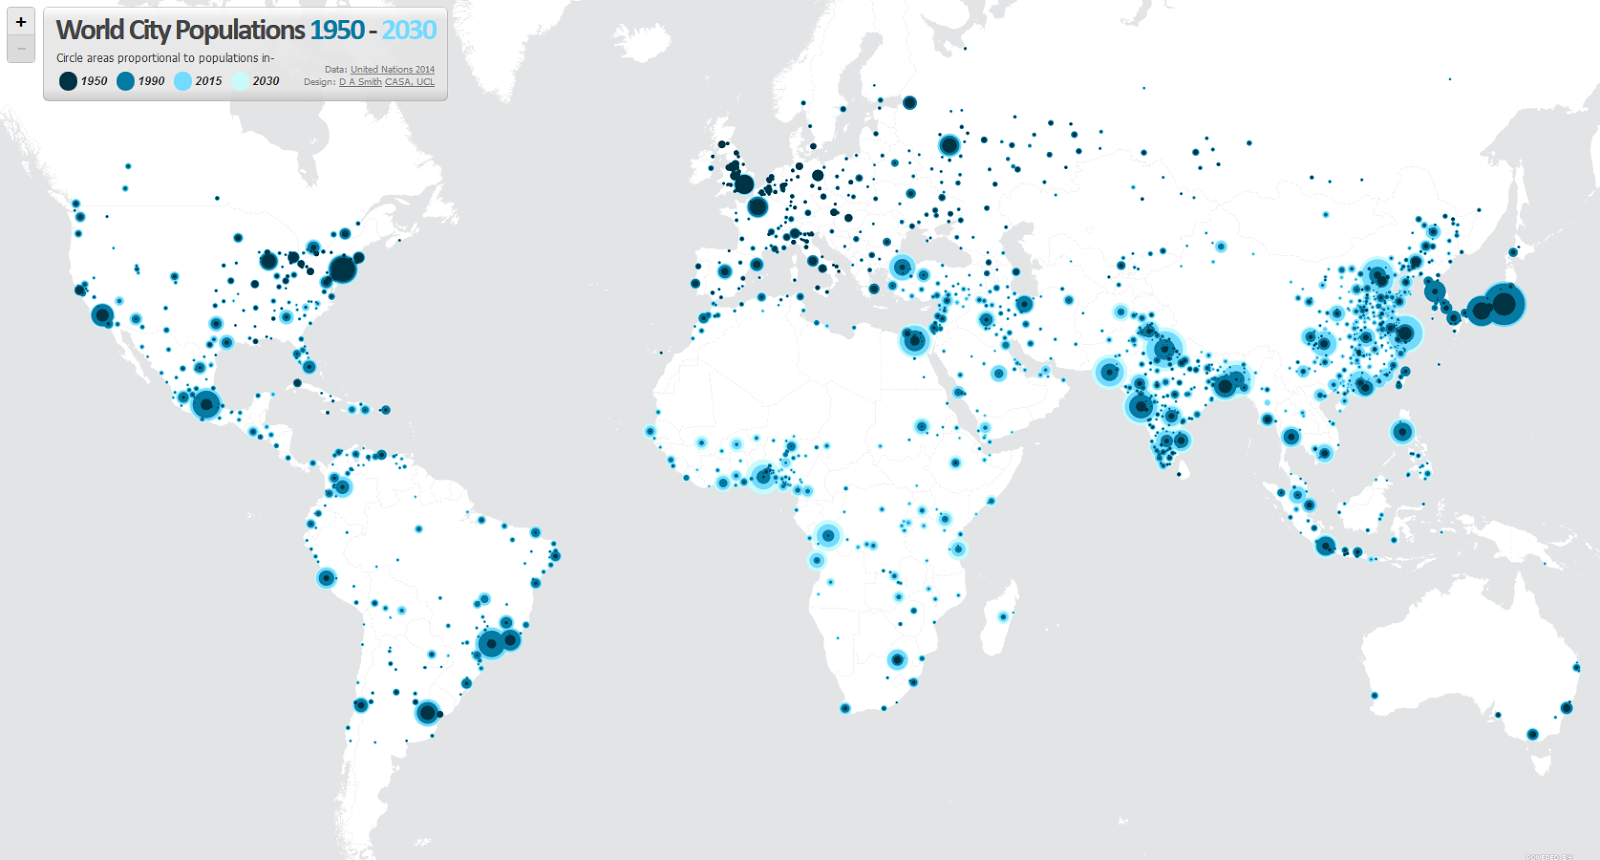
This map visualizes the radical transformation that has occurred across the globe in the last 60 years, from a 30% urban world in 1950, to a 54% urban world in 2015 and a predicted two-thirds urban world in 2050. In 1950 there were 740m people living in cities; there are now 4 billion, rising to a predicted 6.3b by 2050. The circles on the map are proportional to city populations in 1950, 1990, 2015 and 2030. Move your mouse over cities to explore their detailed dynamics. Data is from the UN World Urban Prospects.
Industrialization and urban growth in the 19th and early 20th centuries were powered by Western Europe and the North-Eastern USA, but the urban population of these regions has not expanded since 1950. Recent growth is instead the result of rapid urbanization in China, India, Latin America and increasingly Africa. Over half of the world’s urban population is now in Asia, with China alone comprising 20% of the global total. Asia and Africa will together account for 90% of the additional 2.3b urban dwellers predicted between 2015 and 2050.
The pace of recent change at the city level is unprecedented in human history. Shanghai (click on the city link to focus the map) gained 16 million people between 1990 and 2015, Beijing 13.6 million, Dhaka 11 million. Delhi gained 16 million residents between 1990-2015 and is now the world’s second-largest city of 26m. Delhi will likely overtake Tokyo to become the world’s largest city in the 2030s with nearly 40m residents.
Small towns like Shenzhen, Xiamen, and Dubai have become cities of several million in a little over two decades. While the proportion of urban residents living in large cities is increasing, it is important to realize that 50% of the global urban population lives in settlements of less than 0.5m. The minimum population threshold for cities included in this map is 0.3m.
Our increasingly urban world now frames many of society’s greatest challenges. From global equality to health, education, prosperity and, not least, sustainability, solutions need to be interwoven with fostering livable, efficient and inclusive cities.
Waves of Growth
We can see distinct waves of urban growth and stagnation over time. In the 1960s and 1970s, economic growth in Japan, Mexico, Brazil and later South Korea produced rapid urban growth. This growth peaked in 1990 in Japan, in 2000 in South Korea, and city populations are now peaking in Latin America. This is the typical urbanization cycle of population stabilization following development.
China and India’s rapid growth has been much more recent, accelerating in the 1990s and 2000s. China’s growth is predicted to slow over the next two decades, with its total population peaking around 2025, although it’s the rate of urbanization will continue to rise towards 70% in 2030. India’s population growth will continue much longer to around 2060. There remains a huge rural Indian population of 800 million people, a significant proportion of which will urbanize in the coming decades.
Meanwhile, many sub-Saharan African countries are just beginning their rapid urban expansion. Lagos is set to gain 11 million residents between 2015 and 2030, Kinshasa 8 million, Dar es Salaam 5.6 million, Luanda 4.9 million. Urbanization in Africa will ideally bring the scale of poverty reduction achieved in countries like China, though clearly there are many challenges and huge diversity across the region.
The rise of the megacity
In 2039 nearly 9 percent of the Earth’s population will be residing in just 41 megacities.