Black Protestant churches are historically Black Protestant congregations shaped by the African American experience in the United States. ARDA groups them into seven major denominations, including the AME, AMEZ, CME, Church of God in Christ, and the major National Baptist bodies.
The seven denominations that form the historically Black Protestant tradition grew out of the same Baptist, Methodist, and Pentecostal roots as their white counterparts. What sets them apart is governance, not theology. White-led congregations denied Black members any real voice in church leadership. Free Black worshippers responded by building their own institutions, starting in the late 1700s.
Today, the historically Black Protestant tradition accounts for about 5% of American adults, smaller than the evangelical (23%) and mainline (11%) Protestant shares.
Among Black American adults specifically, that ranking reverses. According to Pew Research Center, 44% of Black Americans belong to a historically Black Protestant denomination, compared with 15% in evangelical churches and 4% in mainline ones.
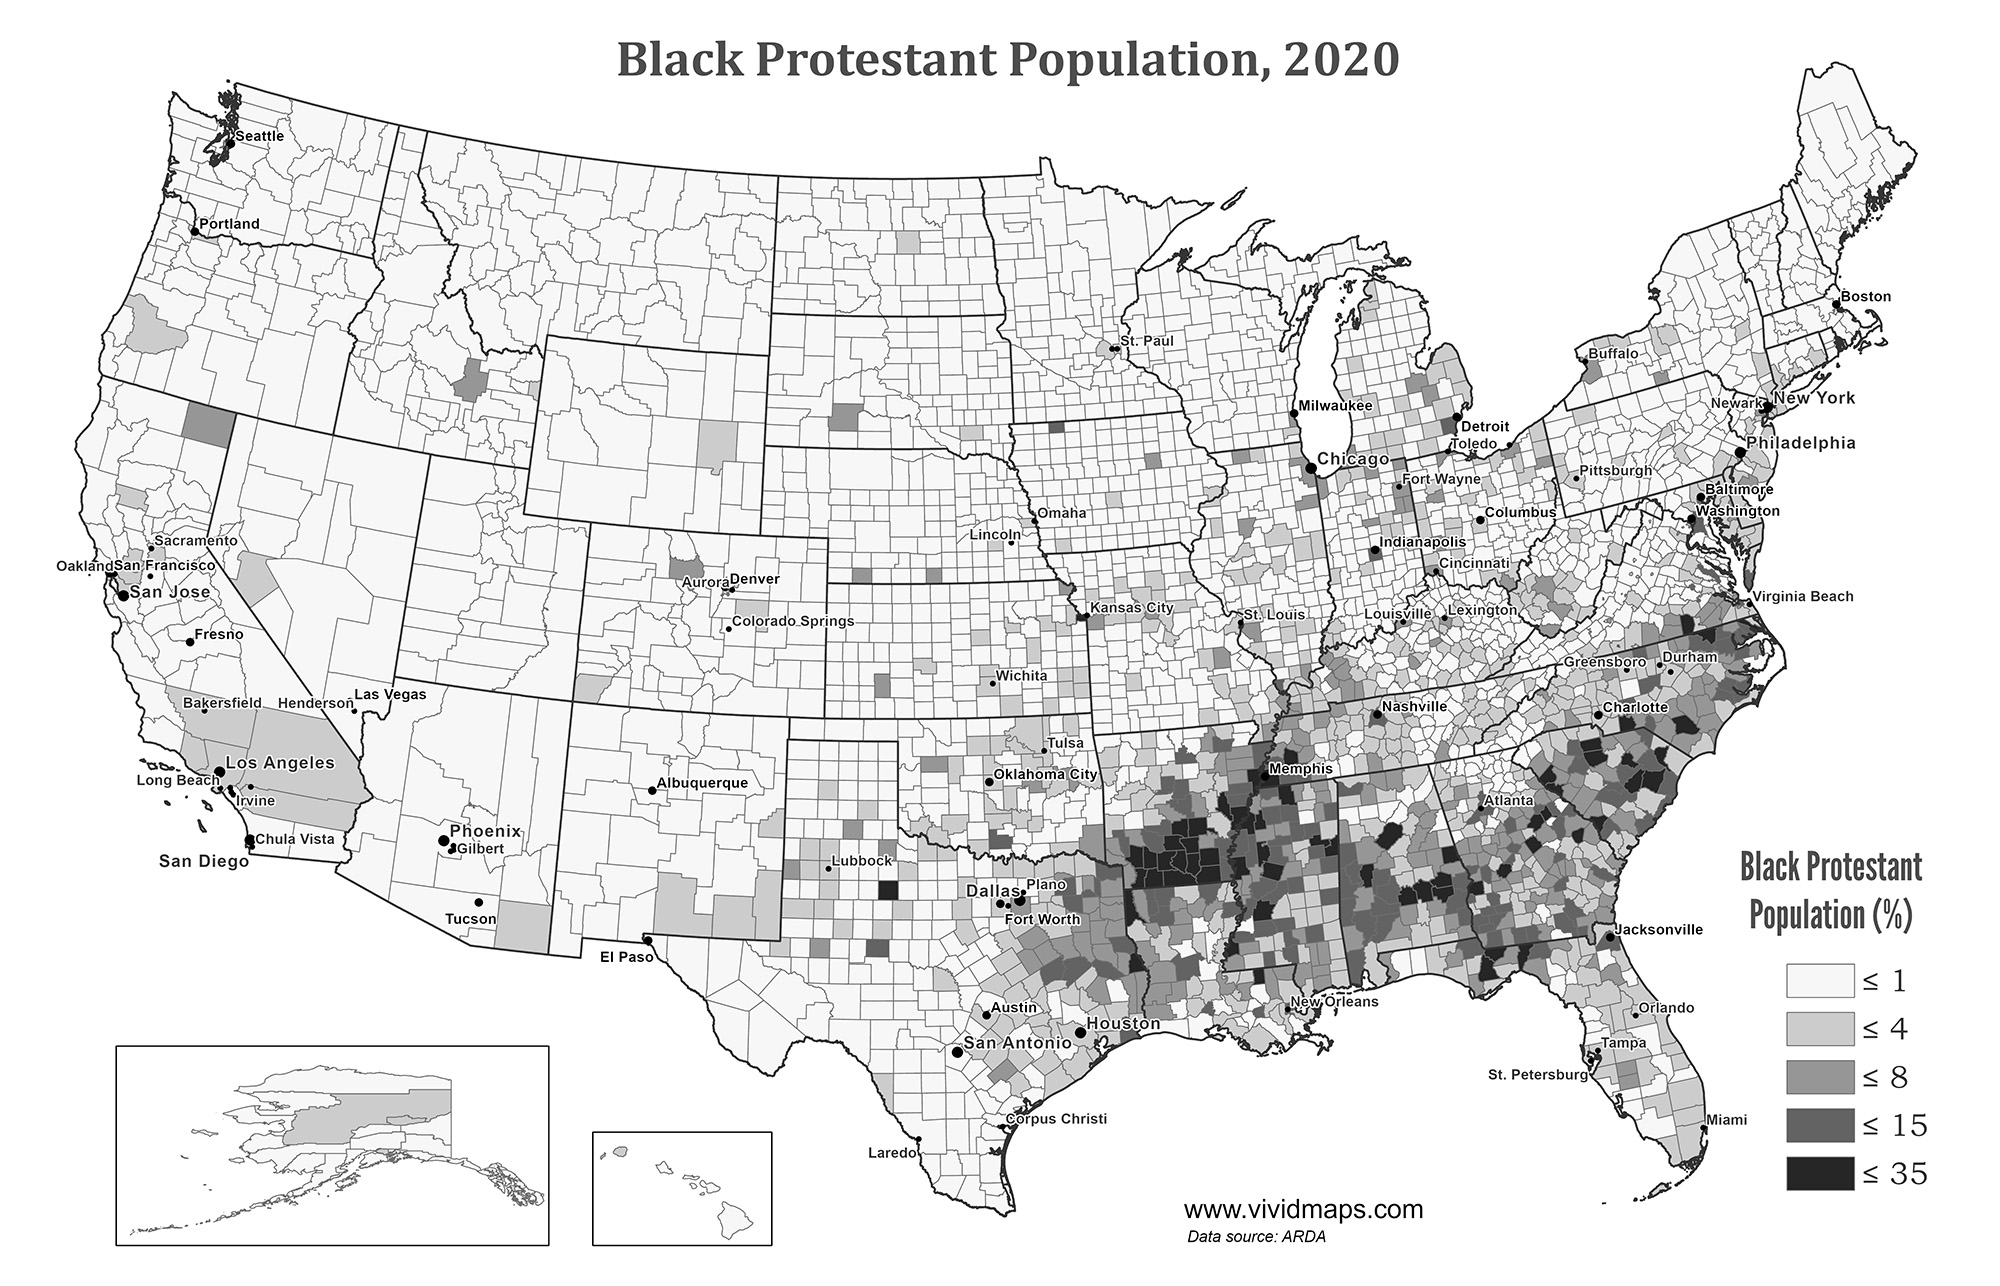
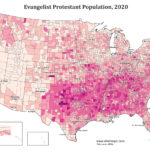
The map below shows the Black Protestant population by county. I created this map using data from ARDA’s 2020 U.S. Religion Census.
The national map leans heavily South. The densest concentrations fall across the historic Black Belt, the arc of counties running through Mississippi, Alabama, Georgia, and the Carolinas where Black communities have been large and continuous for generations.
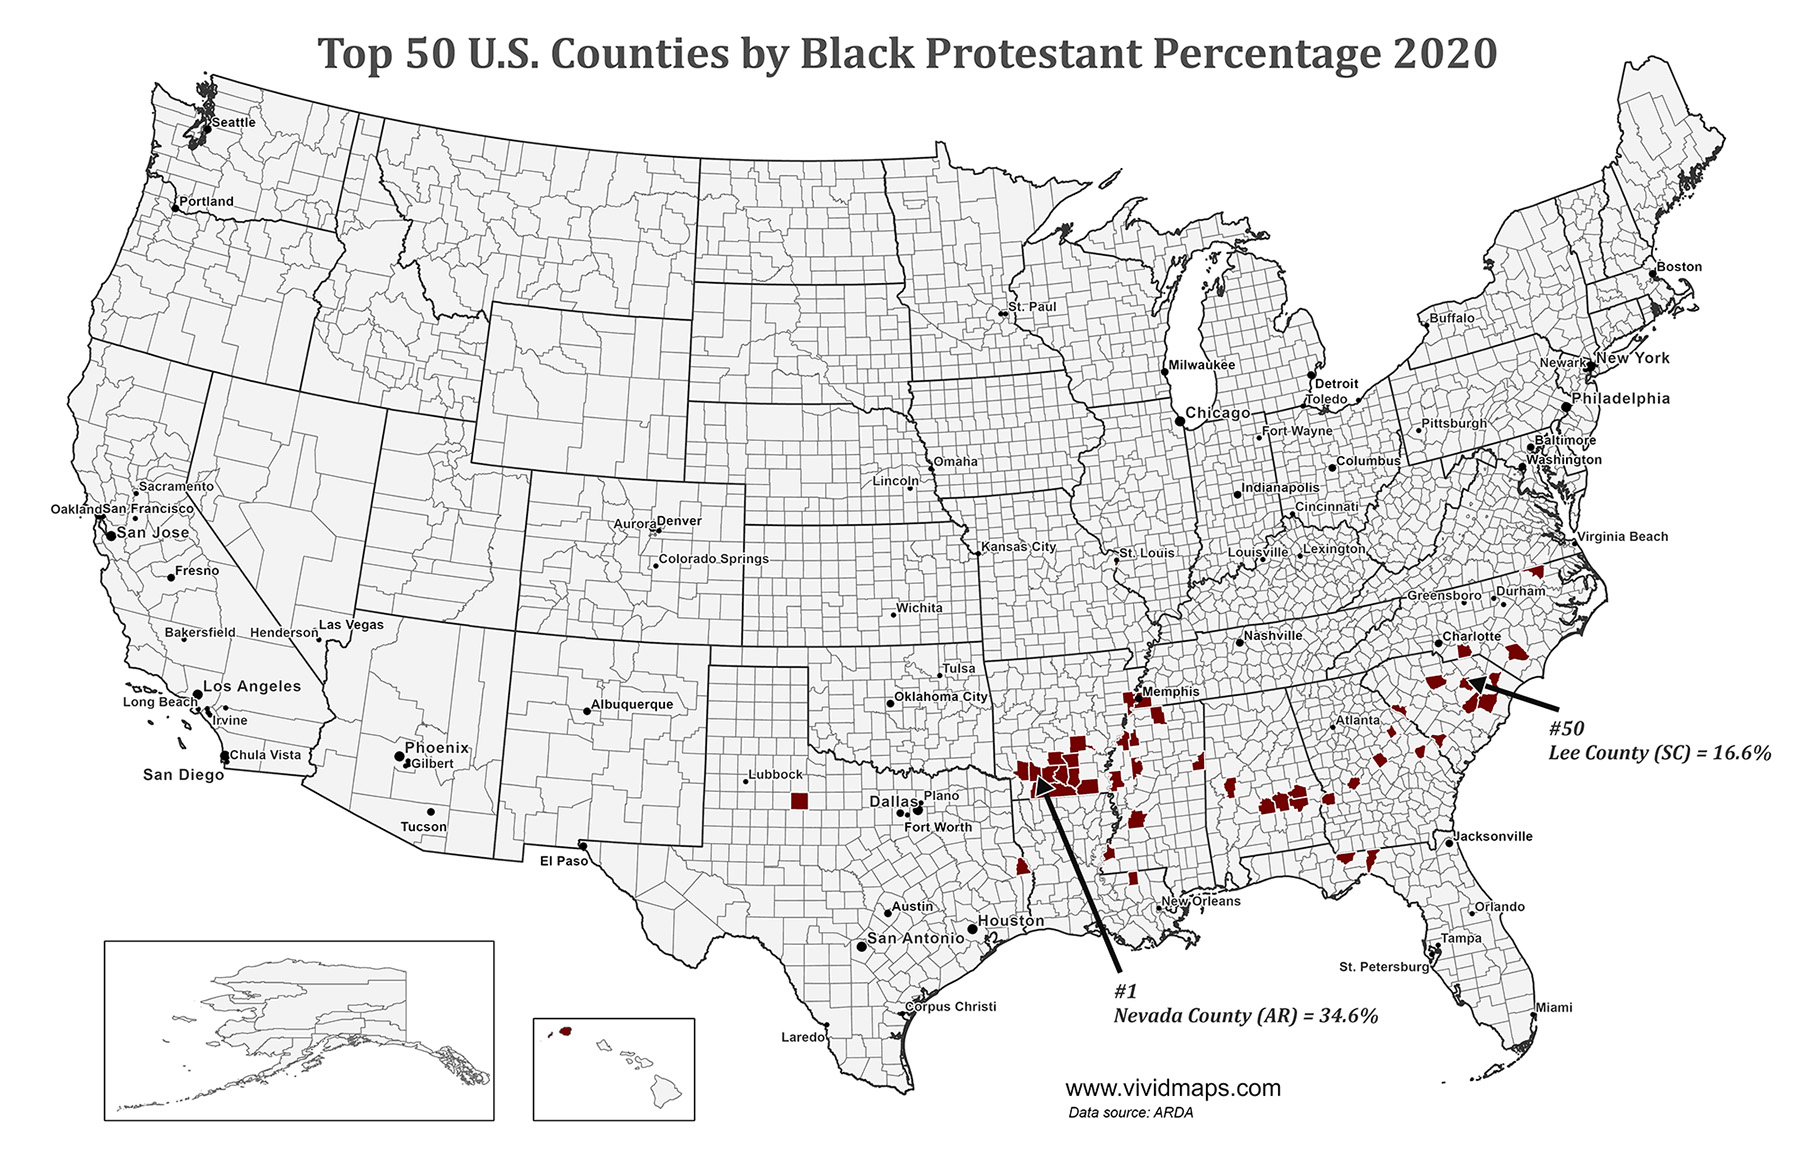
Top 50 U.S. Counties by Black Protestant Percentage
Rank
County
State
Black Protestant Adherents (%)
1
Nevada County
Arkansas
34.62
2
Adams County
Mississippi
33.98
3
Northampton County
North Carolina
29.60
4
Macon County
Alabama
29.21
5
Lowndes County
Mississippi
28.82
6
Ouachita County
Arkansas
26.85
7
Columbia County
Arkansas
25.67
8
Franklin city
Virginia
24.98
9
Anson County
North Carolina
24.29
10
Stonewall County
Texas
24.10
11
St. Helena Parish
Louisiana
23.74
12
Lowndes County
Alabama
23.23
13
Martinsville city
Virginia
23.01
14
St. Louis city
Missouri
22.81
15
Bladen County
North Carolina
22.72
16
Union County
Arkansas
22.48
17
Washington County
Mississippi
22.12
18
Bullock County
Alabama
21.96
19
Jefferson County
Arkansas
21.47
20
Marion County
South Carolina
20.69
21
Gadsden County
Florida
20.67
22
Hempstead County
Arkansas
20.55
23
Crittenden County
Arkansas
20.45
24
Fairfield County
South Carolina
20.15
25
Shelby County
Tennessee
19.82
26
Hinds County
Mississippi
19.79
27
Montgomery County
Alabama
19.45
28
Jefferson County
Florida
19.35
29
Calhoun County
Arkansas
18.99
30
Wilkinson County
Georgia
18.91
31
Leflore County
Mississippi
18.80
32
Bradley County
Arkansas
18.64
33
Cleveland County
Arkansas
18.59
34
Stewart County
Georgia
18.52
35
Dallas County
Arkansas
18.51
36
Clarendon County
South Carolina
18.35
37
Ashley County
Arkansas
18.34
38
Allendale County
South Carolina
18.24
39
Hale County
Alabama
18.17
40
Coahoma County
Mississippi
18.17
41
Macon County
Georgia
17.91
42
Emporia city
Virginia
17.87
43
Quitman County
Mississippi
17.78
44
McCormick County
South Carolina
17.72
45
Warren County
Georgia
17.14
46
Marshall County
Mississippi
17.13
47
Jenkins County
Georgia
16.85
48
Sabine County
Texas
16.84
49
Williamsburg County
South Carolina
16.74
50
Lee County
South Carolina
16.63
Nevada County, Arkansas leads at 34.62%. More than one in three residents. Adams County, Mississippi at 33.98%. Northampton County, North Carolina at 29.60%.
The top 50 is almost entirely rural and Southern. Shelby County, Tennessee (Memphis) at 19.82% and St. Louis city at 22.81% are among the few urban entries. Most counties on the list have small total populations. A few hundred active congregants can move the percentage substantially.
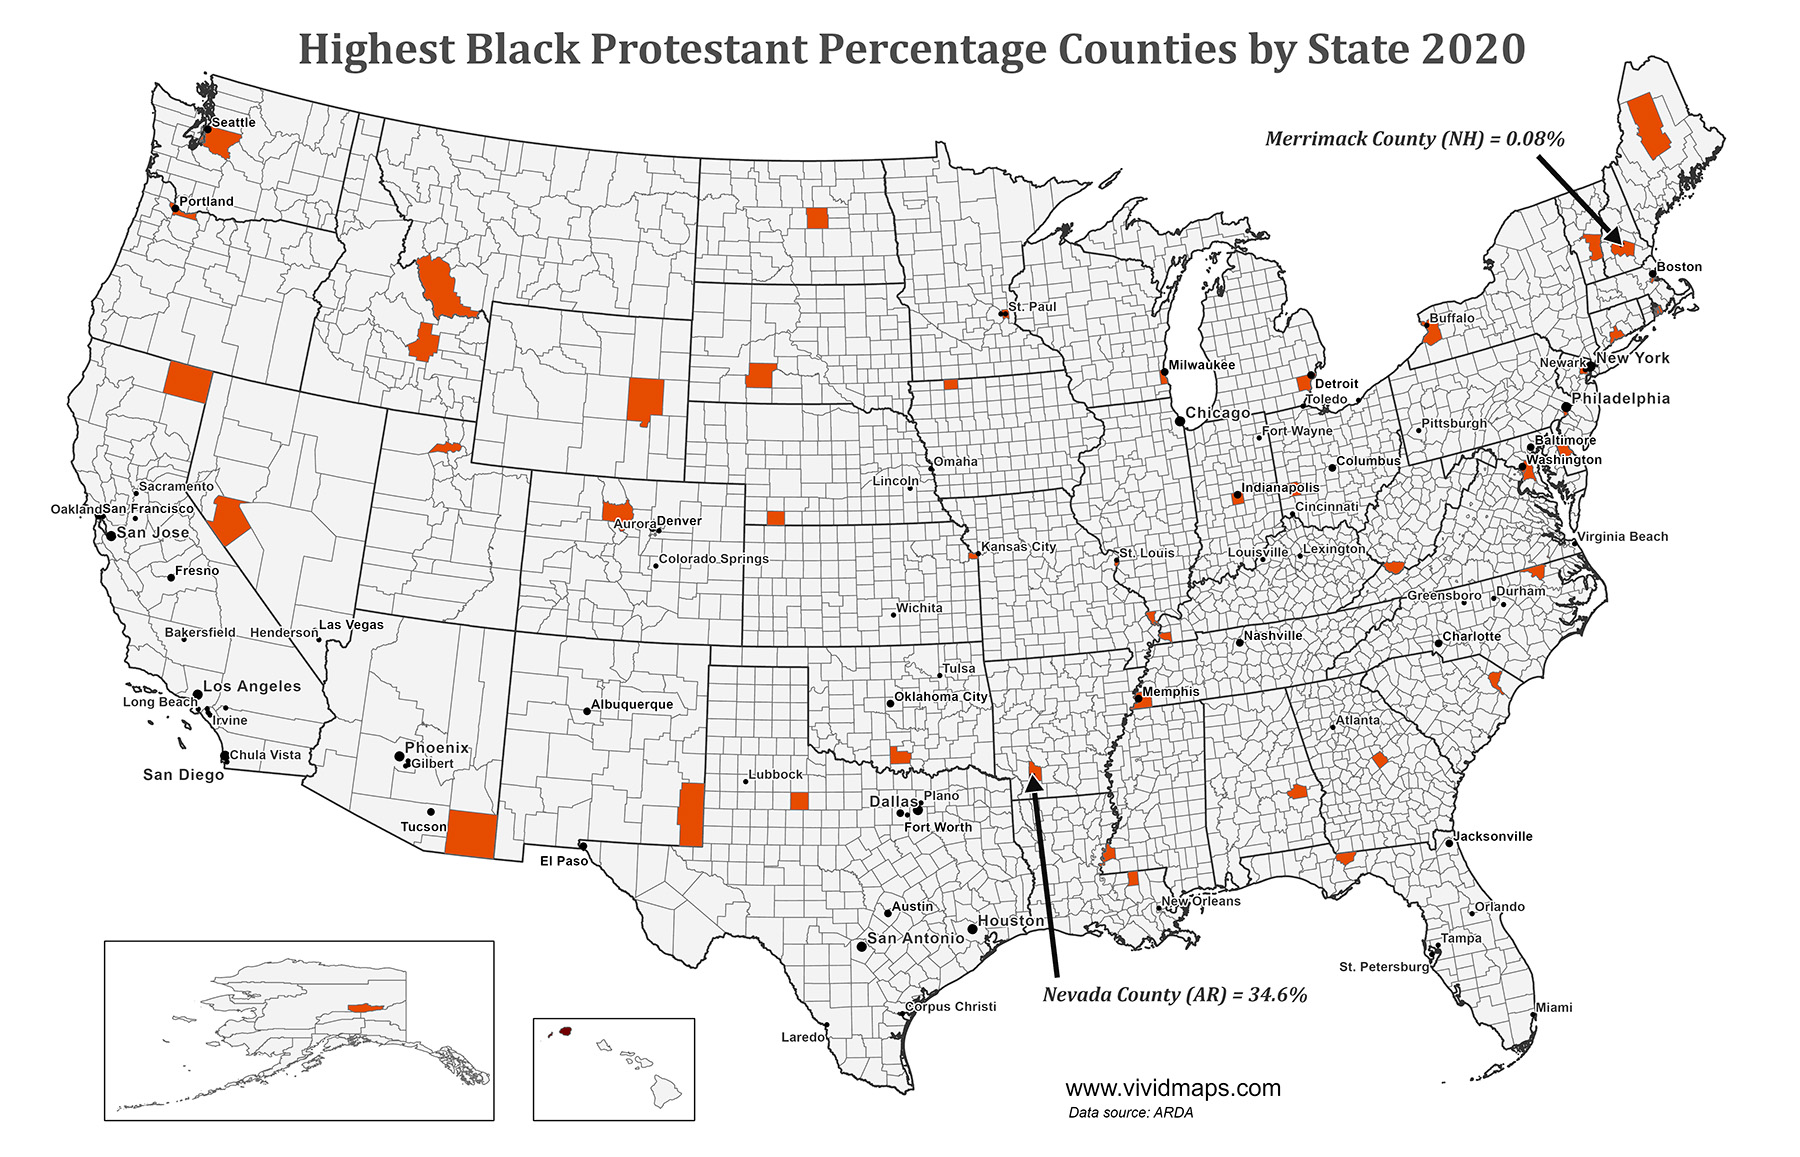
Each state’s leading county appears in the table below.
Highest Black Protestant Percentage County by State
State
Leading County
Black Protestant Adherents (%)
Alabama
Macon County
29.21
Alaska
Fairbanks North Star Borough
2.10
Arizona
Cochise County
1.25
Arkansas
Nevada County
34.62
California
Modoc County
4.67
Colorado
Grand County
5.09
Connecticut
South Central Connecticut Planning Region
1.43
Delaware
Kent County
1.80
District of Columbia
District of Columbia
10.42
Florida
Gadsden County
20.67
Georgia
Wilkinson County
18.91
Hawaii
Kauai County
1.84
Idaho
Butte County
4.66
Illinois
Alexander County
9.54
Indiana
Marion County
8.31
Iowa
Dickinson County
8.47
Kansas
Wyandotte County
15.13
Kentucky
Hickman County
7.70
Louisiana
St. Helena Parish
23.74
Maine
Piscataquis County
0.89
Maryland
Prince George’s County
10.26
Massachusetts
Suffolk County
0.95
Michigan
Wayne County
10.42
Minnesota
Ramsey County
1.17
Mississippi
Adams County
33.98
Missouri
St. Louis city
22.81
Montana
Beaverhead County
0.81
Nebraska
Hitchcock County
5.73
Nevada
Mineral County
2.64
New Hampshire
Merrimack County
0.08
New Jersey
Essex County
5.19
New Mexico
Lea County
1.66
New York
Erie County
4.40
North Carolina
Northampton County
29.60
North Dakota
Wells County
3.52
Ohio
Montgomery County
7.01
Oklahoma
Carter County
8.23
Oregon
Multnomah County
1.09
Pennsylvania
Philadelphia County
5.50
Rhode Island
Newport County
0.24
South Carolina
Marion County
20.69
South Dakota
Jackson County
5.35
Tennessee
Shelby County
19.82
Texas
Stonewall County
24.10
Utah
Weber County
0.45
Virginia
Franklin city
24.98
Washington
King County
0.82
West Virginia
McDowell County
7.44
Wisconsin
Milwaukee County
5.52
Wyoming
Converse County
1.09
The range is large. Arkansas, Mississippi, North Carolina, and Alabama anchor the upper end. Merrimack County, New Hampshire at 0.08%. Newport County, Rhode Island at 0.24%. Weber County, Utah at 0.45%. Even major metro counties like Suffolk County, Massachusetts (Boston) and Multnomah County, Oregon (Portland) register around 1%.
These maps show where Black communities have been large and continuous since the antebellum period. The Great Migration moved millions northward between 1910 and 1970, but it concentrated people in specific cities. In much of the South, that historic geography hasn’t changed.