Eating out has become a popular lifestyle among customers in the U.S. because restaurants are not only a spot to get food. They are additionally a place to meet the community.
More than one million restaurant locations in the United States, employing almost 15 million workers; 101,811 of them in 2021 were chain restaurants. Because of the pandemic, the total restaurant sales were just $565 billion, which is $334.2 billion less than the COVID-19 pandemic prediction.
The restaurant business is callous. The average lifespan of a restaurant is 5 years, and according to some assessments, up to 90 percent of new ones collapse within the 1st year.
Which American city has the most number of restaurants?
One of the symbols of a great city is an array of numerous places to eat.
The largest restaurant city is San Francisco, with 39.3 eateries per 10 thousand households. Other restaurant-dense cities include New York City, Boston, Providence city, Bridgeport, Seattle, Los Angeles, and San Jose.
The 10 Ten Restaurant-Dense cities and counties in the U.S. by number of eateries per 10 thousand households
San Francisco (California): 39.3
Fairfield County (Connecticut): 27.6
Long Island (New York): 26.5
New York (New York-New Jersey): 25.3
Seattle (Washington): 24.9
San Jose (California): 24.8
Orange County (California): 24.8
Providence (Rode Island-Massachusetts: 24.3
Boston (Massachusetts): 24.2
Portland (Oregon-Washington): 24
Full-Service Restaurants
Full-service restaurants are eateries that provide food services to clients who order and are served while in the restaurant and pay after eating. It was determined that there were 33.2 thousand full-service restaurant franchise businesses across the country in 2019.
In a pre-pandemic study, about 44 percent of U.S. citizens said that they very much like eating out at a full-service restaurant.
Independent restaurants
Independent restaurants dominate with about 490 thousand or 58% of the industry total, compared to 232 thousand chain restaurants representing 32% of the industry total. Of the independent restaurants, 68 percent were classified as full-service restaurants and 32 percent as limited-service restaurants. However, the sales volume of independent operators is usually less than the sales volume of chain restaurants.
According to Market research company NPD group, the number of independent restaurants in the United States is dropping. The decline in independent restaurants was primarily in sit-down restaurants, as Americans frequently choose grab-and-go delivery options.
Most Successful Independent Restaurants
Independent Restaurants
Annual sales in US dollars (2019)
Joe’s Stone Crab
38,400,000
Carmine’s (New York)
36,889,370
The Boathouse Orlando
35,499,910
Old Ebbitt Grill
33,291,280
Lavo New York
27,521,650
Smith & Wollensky
25,474,000
Gibsons Bar & Steakhouse
25,167,986
Balthazar
25,100,000
Bryant Park Grill & Cafe
24,700,000
Junior’s
23,661,885
Quick-service restaurants
Quick service restaurants combine limited-service eating places, fast-food eateries, pizza-delivery businesses, beverage and ice cream cafes, carryout sandwich stores, and service shops with on-premise baking cookies, donuts, and bagels.
According to the poll in 2016, 20 percent of the U.S. citizens aged 18 years and older feast out at quick-service restaurants once per week, while 18 percent said they eat out several times per week.
Chain restaurants
Chain restaurants, generally, tend to fall more within the quick-service category.
Ibis World published in 2020 more than 125 thousand chain restaurant businesses in the United States, with a 1.4 percent year-on-year average growth from 2015 to 2020. The number of chain restaurant businesses is forecasted to rise by 1.9 percent in 2020. The Southeast region of the country is where most of the chain restaurants are placed.
In 2020, more than 4 million employees worked in the quick-service restaurant industry in the United States.
The map below created by @MetricMaps shows the percent full service vs fast-food restaurants by county.
The largest fast-food restaurant chain in the U.S.
The quick-service restaurant business has pulled back significantly in the last couple of years because of the pandemic. Sandwich colossus Subway remains the largest restaurant chain across the country with 24.8 thousand domestic locations (2019).
Largest Fast-Food Chains in the U.S.
Rank
Fast-Food Chains
Number of locations
1
Subway
23,802
2
Starbucks
15,041
3
McDonald’s
13,846
4
Dunkin’
9,630
5
Pizza Hut
7,416
6
Burger King
7,346
7
Taco Bell
7,089
8
Domino’s
6,157
9
Wendy’s
5,852
10
Dairy Queen
4,381
The best fast-food restaurant chain in the U.S.
According to the American Customer Satisfaction Index, Chick-fil-A has declared the number one place as U.S. best fast-food chain for the 4th year in a series. In 2020, it held its rank with a score of 84. With 4.5 billion of profit, Chick-fil-A overpassed all fast-food restaurant chains, including big old McDonald’s, which gained 40.1 billion sales during the year.
Leading Fast-Food Chains in the U.S.
Rank
Fast-Food Chains
American Customer Satisfaction Index Scores
1
Chick-fil-A
84
2
Chipotle Mexican Grill
80
3
KFC
79
4
Arby’s
79
5
Dominos Pizza
79
6
Subway
79
7
Panera Bread
79
8
Dunkin’ Donuts
79
9
Papa John’s
78
10
Starbucks
78
Below is a popularity rating founded on the percentage of people who have a positive opinion of a dining brand based on over 20 million responses, according to YouGov.
The Most Popular Dining Brands
Rank
Fast-Food Chains
Fame, %
Popularity, %
1
Dairy Queen
96
73
2
Baskin-Robbins
94
71
3
Wendy’s
98
69
4
Krispy Kreme
97
66
5
The Cheesecake Factory
95
65
6
IHOP
98
65
7
Dunkin’
95
64
8
Subway
98
63
9
Cinnabon
93
63
10
Outback Steakhouse
93
62
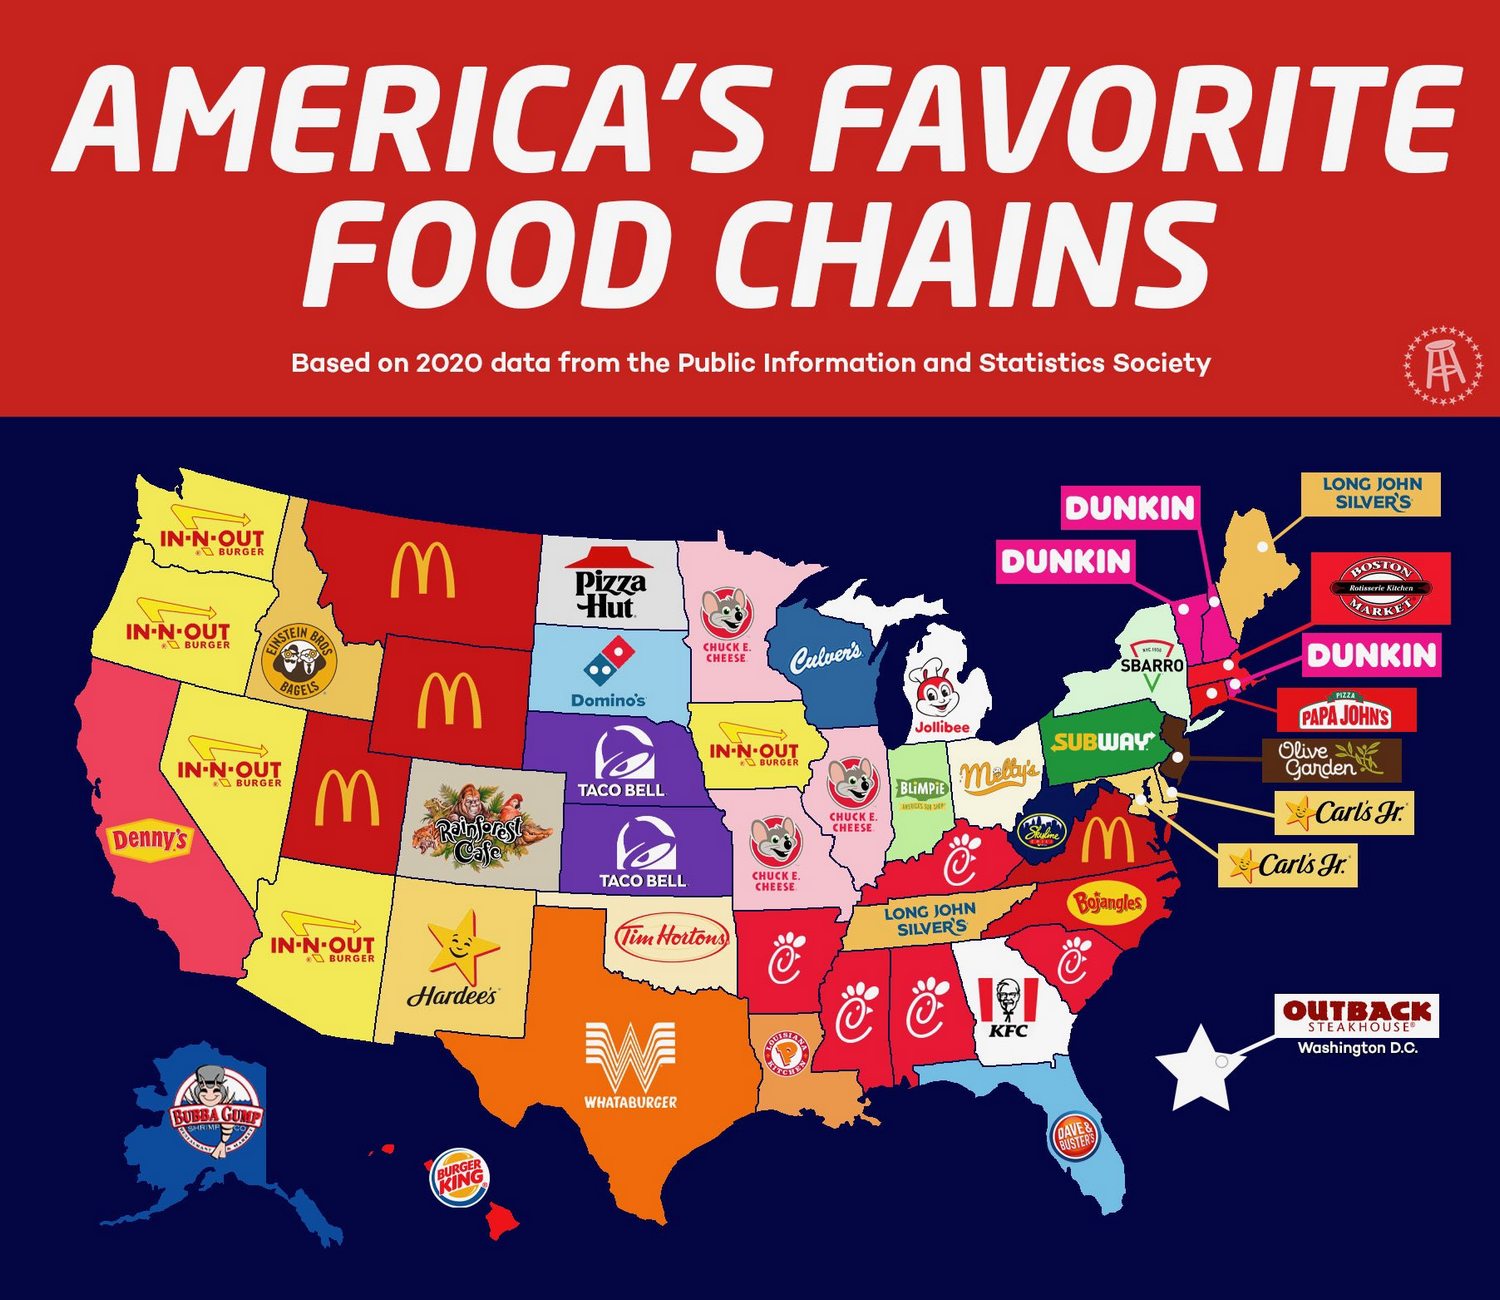
The map below created by @Jollibee shows America’s favorite fast-food chain in every U.S. state.
Since 2004, the American quick-service chain restaurant sector has observed a year-over-year increase, with its peak consumer spending touching around $300 billion in 2018.

 rated fast-food chains across the United States")


