America’s unequal schools
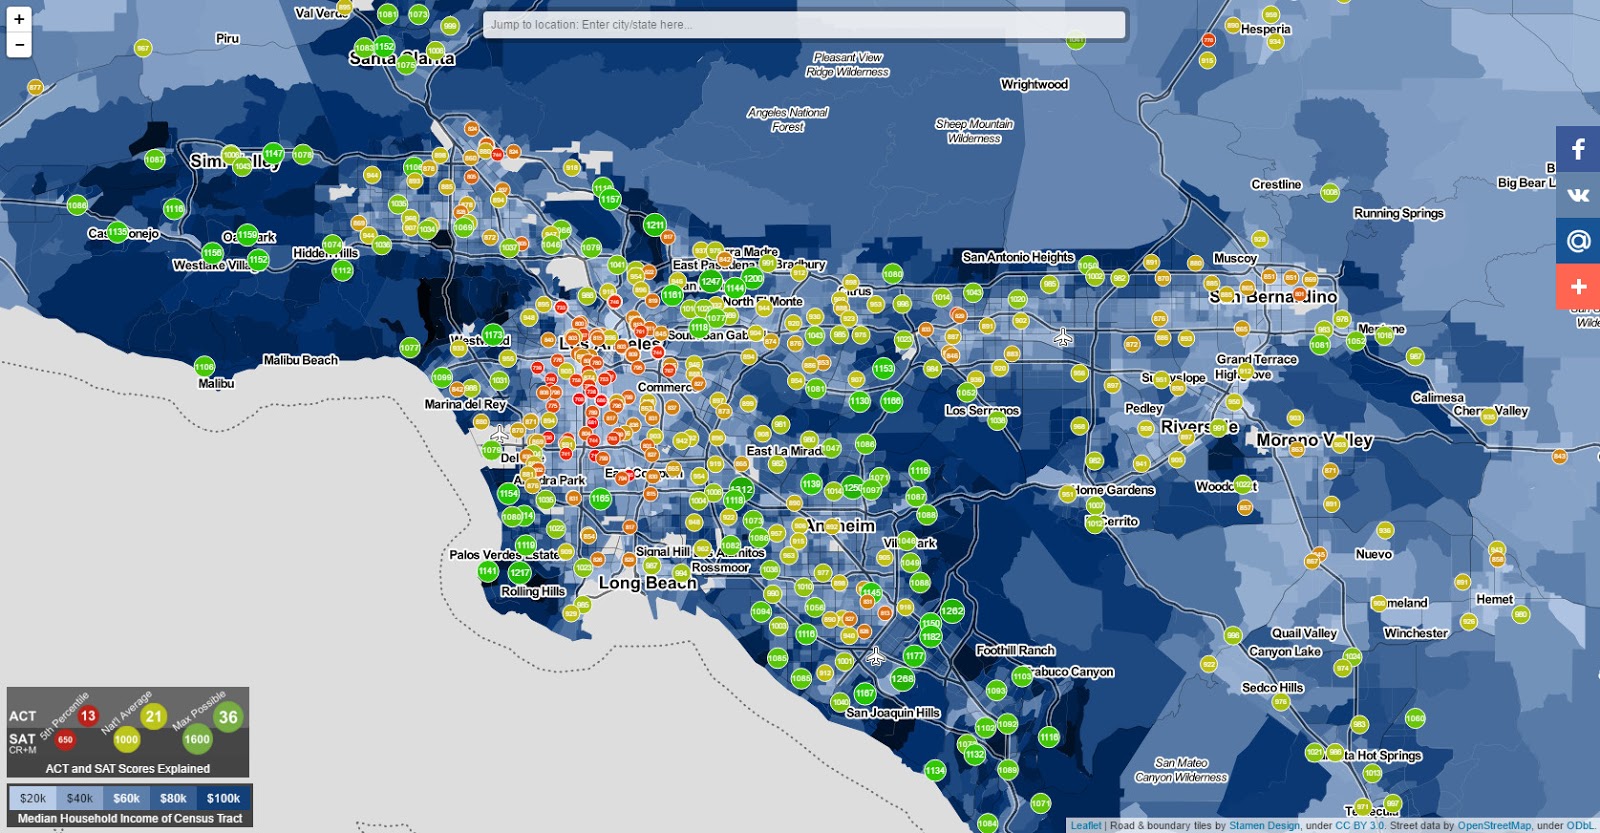
This map is a visualization of average high-school SAT and ACT scores and median household income. Each circle on the map is a high school with at least 150 students, and the size and color of the circle give information about the average college-readiness scores at this school. The circles change from red to green and increase in size as scores go up; the blue background gets darker with increasing household income. Students are not considered college ready until they have ACT scores of about 21 or higher and/or SAT scores of about 1000 or higher.
This map reminds us that education in our country is still separate and unequal, especially in our large urban centers. At many public schools, often in higher-income areas, an average student scores well enough to get into hundreds of colleges across the country. Yet at many other schools, especially those in low-income neighborhoods, even the most hardworking and committed students struggle to get a score that meets the national average.
In the interest of promoting awareness and encouraging conversation around educational inequality, we are providing this national map of the educational achievement and opportunity gap. Data for 21 states plus New York City are presently available, and we hope to add more if more states make their ACT or SAT data public.
As you explore, the Memphis Teacher Residency would like you to remember that many students in our country do not have access to the educational opportunities of other students born just a few miles away. What will you do about educational inequality?


