Economic maps
Maps to explain economic geography.
When do Americans leave for work?
The map above shows when people leave home for work. The rates are for people who have jobs and are
Read More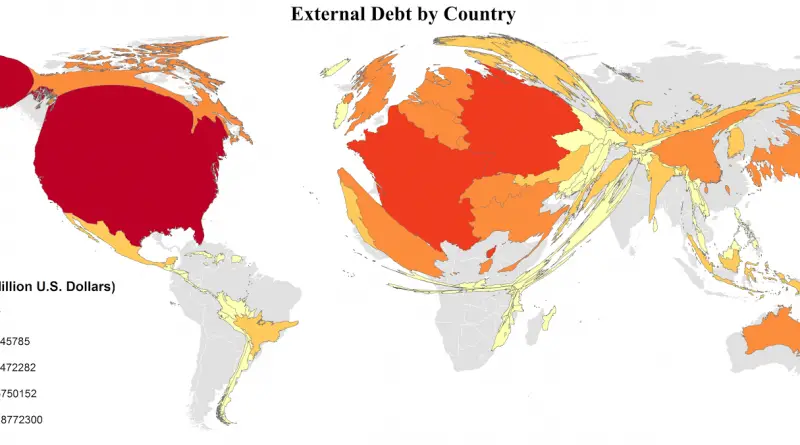
External Debt
External Debt by country External Debt by country per capita Country Debt per capita, $ Debt m $ Luxembourg
Read MoreSatisfaction with Life Index
Satisfaction with Life Index was created by Adrian G. White, an analytic social psychologist at the University of Leicester, using
Read MoreTop Austalian exports and imports to Asia
Via asialinkbusiness.com.au
Read More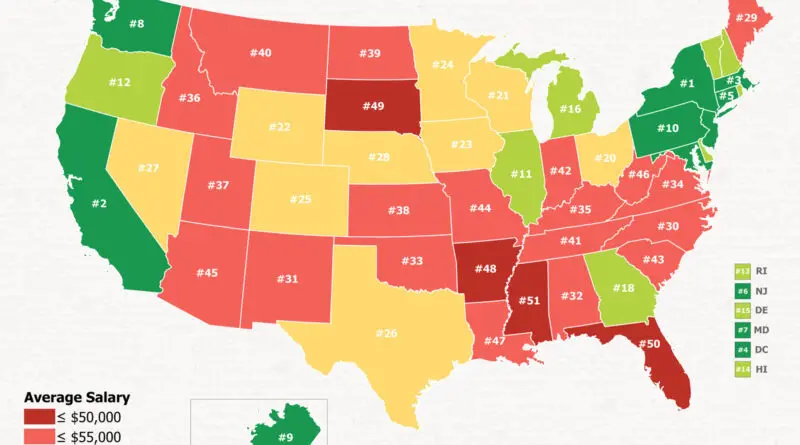
The salary of U.S. teachers mapped
In 2018 there were 3.3 million teachers in the United States. The average public school teacher salary for the 2019-2020 school year nationwide was $63,645, varying from an average of $45,192 in Missippi to $87,543 in New York.
Read MoreThe shape of the UK economy
Via metrocosm.com
Read MoreThe GDP of every U.S. county
The 10 largest US metro areas by GDP U.S. counties with GDP over $100 billion
Read More