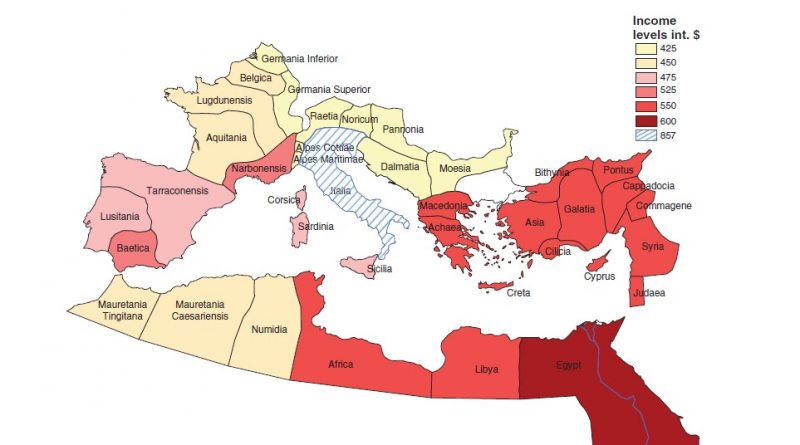
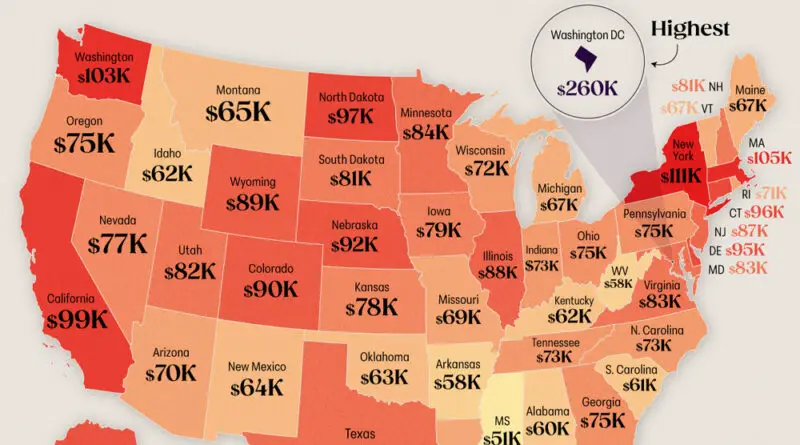
Skip to content
Vivid Maps Logo

Vivid Maps

Maps that explain the World


  • Atlases
  • Map Posters
  • Scratch Maps
  • Globes

Economic maps

Maps to explain economic geography.

Charts Economic maps Wealth 

Imbalance of the components of the Human Development Index visualized on colorwheels

April 11, 2015October 4, 2018 Alex 0 Comments Maps of world

The Human Development Index is a statistic composite index of life expectancy, education, and per capita income indicators, which are

Read more
Economic maps 

Biggest company in each European country

April 11, 2015September 27, 2018 Alex 0 Comments Europe

Top 10 largest European companies by revenue (USD million of dollars) 1. Royal Dutch Shell (Netherlands & UK) – 484,489

Read more
Economic maps 

Annual GDP growth from 1990 to 2007

April 9, 2015September 19, 2018 Alex 0 Comments Maps of world

Top 10 countries with highest grow annual GDP (1990 – 2007): 1. Azerbaijan 25% 2. Angola 23.2% 3. Qatar 18%

Read more
Economic maps 

World Giving Index 2014

April 8, 2015May 6, 2018 Alex 0 Comments Maps of world

Countries have been divided into ten evenly-sized groups based on their World Givin Index score. The Charities Aid Foundation, and

Read more
Economic maps 

Women`s Economic Opportunity Index

April 8, 2015April 29, 2018 Alex 0 Comments Maps of world

Women’s Economic Opportunity Index is based on 29 indicators that measure a country’s laws, regulations, practices, customs and attitudes that

Read more
Economic maps 

The United States of Shame

April 8, 2015April 23, 2018 Alex 0 Comments United States

What is your state the worst at? Alabama: Stroke Alaska: Suicide Arizona: Alcoholism Arkansas: Worst credit score California: Air pollution

Read more
Economic maps 

This map shows US states labeled as countries with similar GDPs

April 6, 2015March 31, 2018 Alex 0 Comments United States

  US economic growth in 2015 was strongest since 2005 (18.04 trillion USD (56,207.04 per capita)).

Read more
Economic maps 

Difference in GDP Per Capita Along The Worlds Borders

April 6, 2015March 30, 2018 Alex 0 Comments Maps of world

Top 15 Largest Border Differences in USD (GDP per capita) Richer Country vs Poorer Country Qatar (102,100) – Saudi Arabia

Read more
Economic maps 

Development of the Debt-to-GDP ratio worldwide

April 1, 2015March 15, 2018 Alex 0 Comments Maps of world

The debt-to-GDP ratio is the ratio between a country’s government debt and its gross domestic product measured in years. A

Read more
Economic maps Historical Maps 

The changing center of economic gravity

March 30, 2015 Alex 0 Comments

Economic center of gravity is calculated by weighting locations by GDP in three dimensions and projected to the nearest point

Read more
Page 67 of 68« First«...102030...6465666768»

Advertisement

Find Us On Facebook

Vivid Maps

Trending now

  • Sea leverl rise
    Climate Change, News, Oceans
  • The most popular brands by country
    Business, Economic maps
  • Mapping
  • Interactive maps, Political maps, Travel
  • The Westward Expansion of the United States
    Historical Maps

Advertisement


Push pin maps · Globe drinks cabinets · Board games · Monopoly · Map-based strategy board games

Vivid Maps Tools

– Find cities with a similar climate
– Find cities with a similar climate (2050)
– How hot cities could be in 2050
– The U.S. Population Lines
– Convert Latitude/Longitude

– About

Copyright © 2021 Vivid Maps. All rights reserved.