Elephant Populations Mapped Across Asia and Africa
A 2023 map by cartographer Wanmei Liang highlights the habitats of every elephant species and subspecies in Asia and Africa.
Read MoreMaps depicting environmental degradation across planet.

A 2023 map by cartographer Wanmei Liang highlights the habitats of every elephant species and subspecies in Asia and Africa.
Read More
Groundwater might be out of sight, but it’s central to everything from farming to clean drinking water. This post dives into where it’s found, how it moves, and why managing it wisely is becoming more urgent in a changing climate.
Read More
What if state and county borders weren’t just lines, but barriers shaped by elevation, rainfall, and population? This series of 3D maps that do just that—transforming geographic and demographic data into eye-catching visualizations.
Read More
Over the past century, Norway’s untouched forests have dramatically disappeared. What right do we have to lecture the rest of the world if the green heart of a developed, wealthy country can disappear so silently?
Read More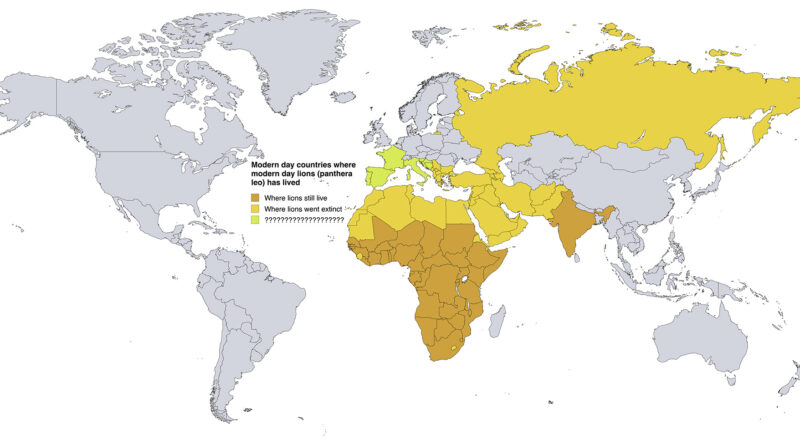
From roaming vast territories across multiple continents to being confined to sub-Saharan Africa and a small region in India, lions have undergone a remarkable geographical transformation. This post explores the historical distribution of Panthera leo, examining how human activities, climate changes, and environmental shifts have dramatically reduced lion habitats over centuries, while highlighting ongoing conservation efforts to protect these iconic predators.
Read More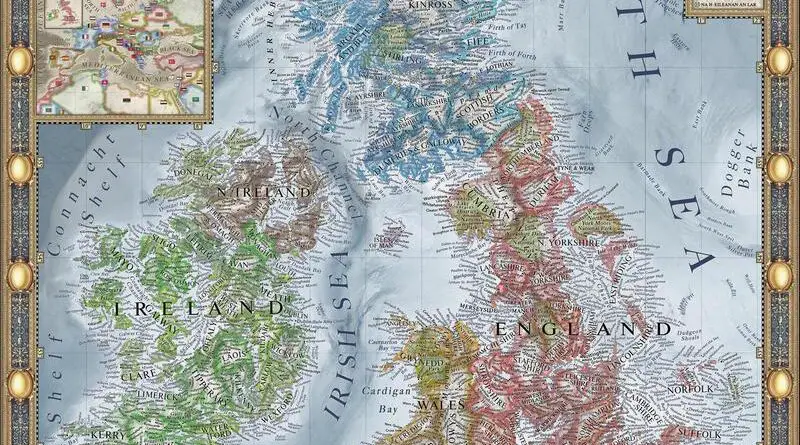
From Doggerland to future flood scenarios, explore how the British Isles’ geography has evolved and what climate change means for its iconic coastlines.
Read More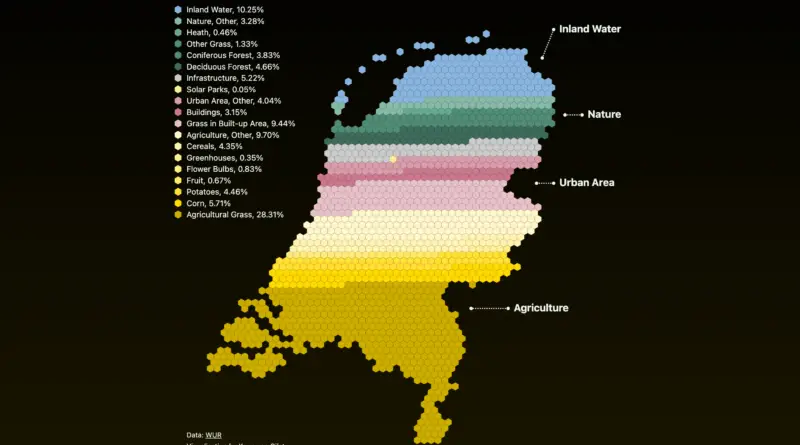
The Netherlands, a land of ingenuity and resilience, showcases a dynamic landscape shaped by meticulous land use and water management. From its efficient agricultural fields to bustling urban centers, preserved nature reserves, and intricate waterways, every aspect of Dutch land use tells a story of adaptation and innovation.
Read More
If all the ice on our planet were to melt, it would result in a substantial rise in the level of the world’s oceans. The estimated sea level rise would be approximately 66 meters (216 feet).
Read More
The sky is wide, the land is rugged, and the air fills your lungs with happiness. But for many adventurers, the genuine appeal of a trek through a national park is the fine detail: the living flora and fauna, often rare and amazing, that quietly inhabit the landscape.
Read More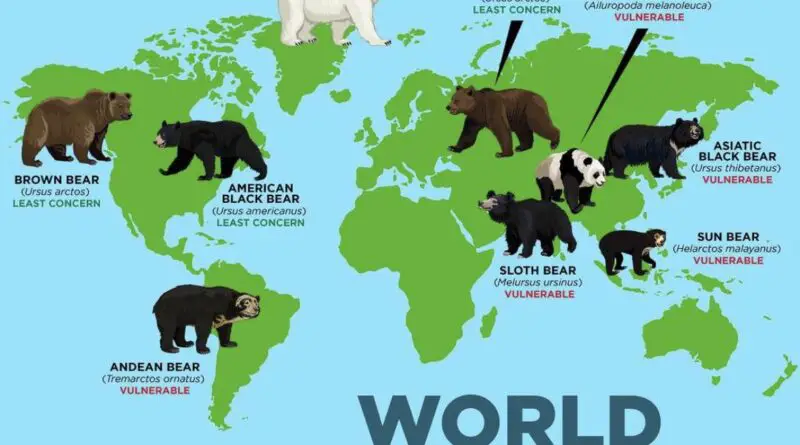
Bears are carnivorous mammals of the Ursidae family. Although only 8 species of bears are existent, they are widespread, living in a wide variety of habitats throughout the Northern Hemisphere and partially in the Southern Hemisphere.
Read More