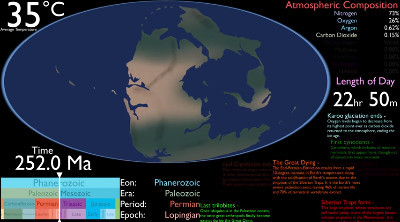
The economic damage from climate change in the U.S.
Estimated change to each state’s GDP based on damages caused by climate change ($). Source: www.howmuch.net Estimated change to
Read moreMaps depicting environmental degradation across planet.
Estimated change to each state’s GDP based on damages caused by climate change ($). Source: www.howmuch.net Estimated change to
Read moreThe map below shows twenty years of all-time temperature records from the 100 thousand approved weather stations in the NOAA
Read moreDifferent types of birds take routes of widely varying lengths. Some round-trip migrations can be as long as 44 thousand
Read moreThe last of wild represents the least influenced areas of major terrestrial biomes. Most wild in each biome is defined
Read moreThe world’s forests absorb and store carbon (296 Gt Carbon) in both above and below ground biomass. The worlds forests
Read moreThe rivers of the American West have shaped the pattern of human development across the region. In turn, human activities
Read moreThis map below shows cropland distribution across the world in a nominal 30-meter resolution. Agricultural lands cover some 40 percent
Read more80.7% of the Earth’s population lives within one hour of a city, but accessibility varies by wealth. In high-income countries,
Read moreThe map below depicts the change in average nighttime light pollution throughout the past 25 years. Red color sows and
Read moreRijkswaterstaat is part of the Dutch Ministry of Infrastructure and the Environment. Its role is the practical execution of the
Read more